

The success of any digital oilfield project is predicated on the quality of the data structure, acquisition, communication, validation, storage, retrieval, and provenance of the data. Therefore, the mission of the digital oilfield architect is clear: Deliver the right data to the right users at the right time.
This task is becoming more difficult because of the sheer variety of sensors, the multitude of data formats, challenges with data communication and synchronization, and the potentially large volume of data produced. While the advent of data analytics has increased the importance of designing fast and efficient data management systems, it is a multifaceted minefield to gather and process data to ensure production is optimized and risk is minimized in both conventional and unconventional operating environments.
Sensor Surge
The existing proliferation of sensors and the projected growth rate of new sensor technology is expected to reach around $30.57 billion by 2026, a boost of 24.65% CAGR (compound annual growth rate), according to market intelligence. The increasing demand for automation is expected to catapult demand in tandem with lowering costs.
More sensors mean new ways of monitoring. As these become more sophisticated, the oil and gas industry will likely become more reliant on edge computing as the technology becomes more prevalent. This growth, it is hoped, will help drive new efficiencies, improve safety, and help satisfy regulatory compliance.
Although many medium and large operators have in-well, downhole distributed temperature sensor (DTS) implementations throughout the world, recovering the data, processing it for accuracy, and making it available for use anywhere within a global enterprise infrastructure can be challenging for wells located in remote locations.
Data Overabundance
As new technologies become available, the growth in data volume is evident. For example, in subsurface monitoring, a typical DTS data file is approximately 160 kilobytes (KB). Given that a DTS instrument typically produces a complete data set every 6 hours, the total data for a single fiber capturing DTS measurements would be 234 megabytes (MB) per year.
Conservative estimates show that the process equipment on a typical offshore platform generates 1–2 terabytes (TB) of data per day. However, some estimations put the potential amount of data generated and associated with each well at closer to 10 TB per day. Regardless of the scale, IHS Market analysis estimates that only 1% of those data are used for decision-making—a miniscule amount by comparison.
Managing the volume of data becomes a problem in itself. Despite the progress of new transmission technologies, something as simple as moving 1 TB of data from a remote location can be burdensome. To put this into perspective, a typical satellite uplink supporting 2 MB per second throughput would take at least 12 days to transfer 1 TB. Whereas a 4G LTE connection, which is familiar technology on mobile phones, with an upstream capacity of 5 Mb per second, still takes at least 6 days.
While there are clear benefits to having extra data, it also creates a whole new set of problems that revolve around how to consume the data efficiently within the application and how to manage the correct data that must be moved.
Efficiently Evaluating Well Performance
In a typical well-monitoring environment, operators rely on downhole temperature and pressure data for evaluating well performance. In many cases, the temperature data are being captured using traditional DTS and, more recently, distributed acoustic sensing (DAS) to provide the acoustic parameters. These data-capture methods rely on fiber-optic lines in the well to record data along the entire length of the fiber, with the resulting information being captured at surface and then stored within data silos for subsequent analysis and interpretation.
In addition to the fiber-optic data, operators also rely on pressure data from downhole gauges. This is invariably stored in a PI (process information) Server independent of the fiber data.
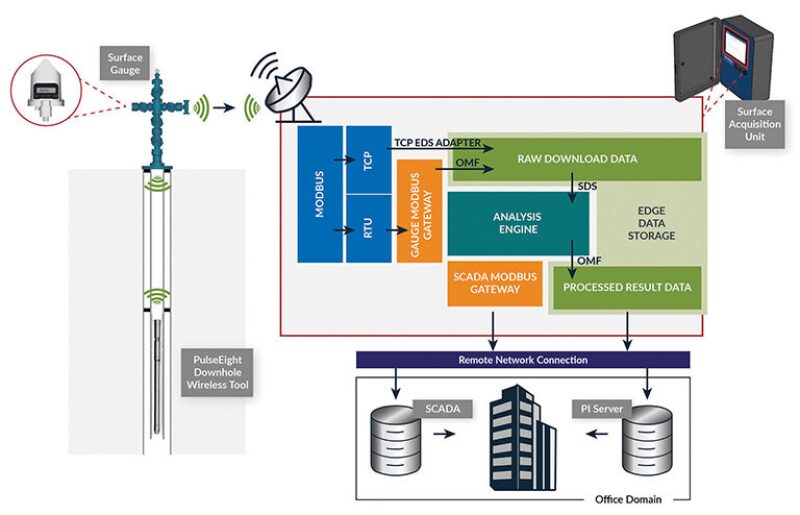
Aside from being the “single source of truth” for the pressure data, it provides a highly efficient process for retrieving and subsequently consuming data. The value is realized by bringing both the fiber data and the pressure data together to understand what is happening downhole, whether it is changes in gas/oil ratio or leaks detected in the casing. In many cases, this can be a time-consuming process. To further compound the situation, delays in analyzing the subsurface environment can have a direct impact on production. Moreover, understanding what is going on below the surface can have a dramatic effect on the direct cost of recovering energy supplies. Ideally, customers want to view data in context to each other so informed decisions can be made on everything from stimulating a well to triaging downhole problems (Fig. 1).
Implementation of DTS—A Case Study
Understanding the relative contribution to production by different zones at different times in the wells’ life and whether a single zone dominates production adds value to planning future wells. Tendeka was tasked by a major producer with a multiphase development across 12 coal-seam gas wells in the Surat Basin, Australia (SPE 186203), to assess well health and improve data analysis.
Since the basin is located in a remote and extreme environment, the first obstacle was to secure and maintain power and connectivity. Enhanced Data Rates for GSM Evolution (2G EDGE) data speeds were, in some cases, the fastest wireless protocols available when the project was first undertaken in 2016. Accessing the data anywhere globally within the corporate enterprise was a key requirement.
To provide a working solution, each well was equipped with either local gas-powered electrical generators or solar-powered units with battery backup capable of running the DTS units and modem for extended periods without human intervention and, in the case of solar generation, throughout the hours of darkness and times of inclement weather. Each DTS unit was then connected to a General Packet Radio Service (GPRS) modem and, although slow in today’s wireless spectrum, GPRS is an extremely reliable method to communicate data. Large data transfers are not realistically possible due to the limited upstream bandwidth available.
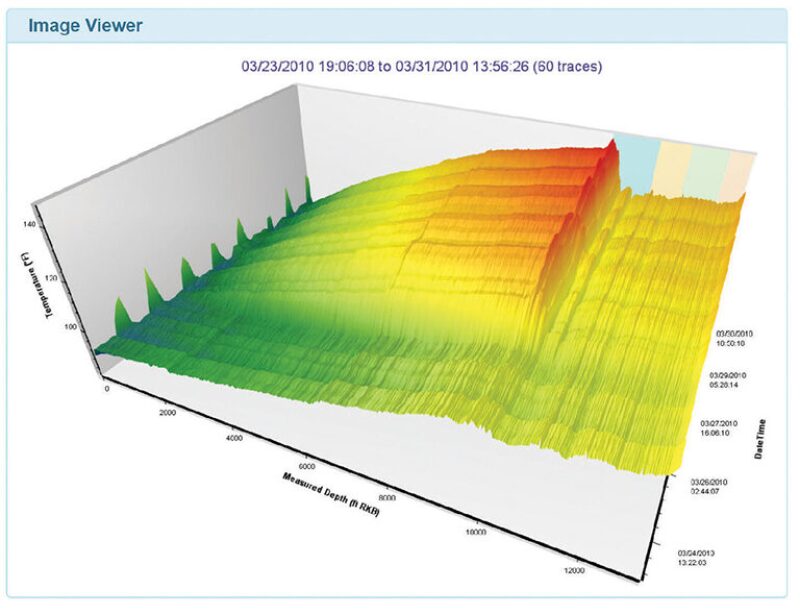
Having created the physical connection, the next task was to recover the data. DataServer software was set up to continuously poll for new DTS measurements as they became available. Once recorded, the measurements would be retrieved from the DTS instrument and copied to the server (Fig. 2).
A second server operating in the data center was installed with software responsible for managing the DTS data. Here, each file is opened and checked against preconfigured rules to determine if the data are coming from the expected wellsite. During import, any errors or data discrepancies are flagged in an alerting system to a human operator so that the data can be manually checked. This also notifies operators if the DTS unit appears to be offline, for example, if the data coming back from the instrument are corrupt or if the modem communications are down.
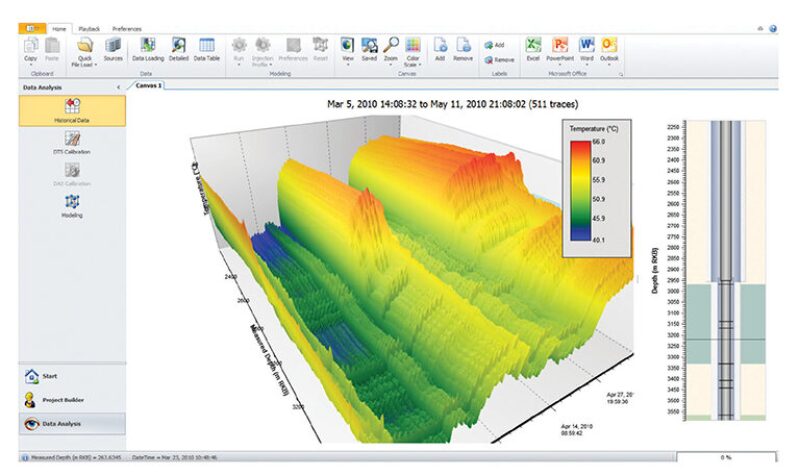
Using Tendeka’s FloQuest analysis and modeling software and automated systems, the application manages data security and access to human operators (Fig. 3).
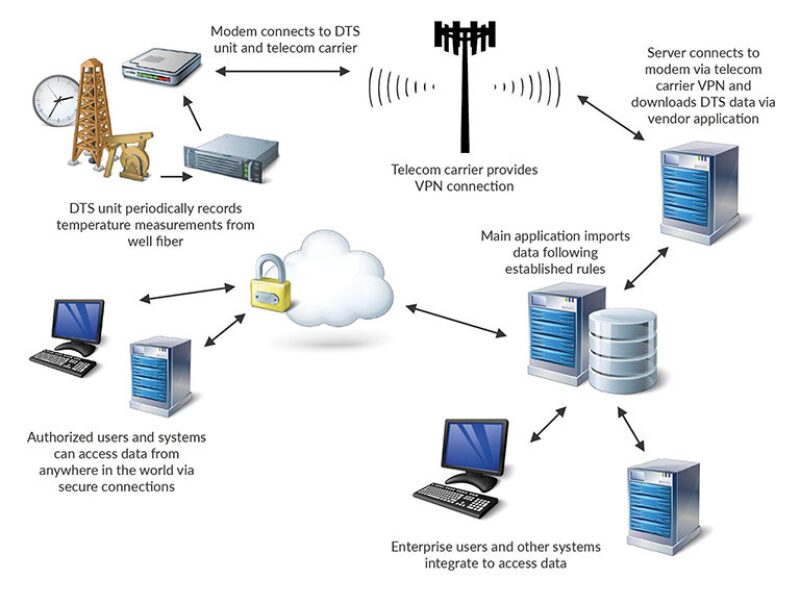
Furthermore, the system has an application programming interface (API) that offers a representational state transfer (REST) interface—the most widely accepted standard of software interoperability over internet-connected devices (Fig. 4).
To date, multiple solutions with a similar or identical architecture have been deployed. The initial solution monitored 12 wells in Australia but has subsequently been scaled to monitor over 100 with another customer in South Asia using the same solution and similar infrastructure. Subsequent projects have been deployed using existing DTS vendors for the instrument boxes. Over 5 billion measurement trace sets have so far been saved and analyzed.
The Future of Digital Oilfield Technologies
As computing power improves and IoT devices become smarter, the truly digital oil field comes closer to reality. The combination of individual solutions has the potential to expose data to new systems that can leverage its worth and make it more valuable.
Tendeka recently joined the OSIsoft EcoSphere, a collection of more than 300 industrial leaders that provide products, applications, and services for the PI System. The company will provide downhole monitoring, analysis, and modeling products to support customers in their digital transformation and integration strategies. This will bolster the value of the existing real-time information that oil and gas customers are currently storing in their PI Servers.
The ability to manage data automatically and process it by handling it at source and then bringing it into a cloud-based solution, means that more data can be processed to its potential value. The same methodologies can be used beyond just DTS data.

Andy Nelson is a senior software engineer with Tendeka and for the past 25 years has been working in software engineering and integration. Prior to Tendeka, he held posts at TellX, a company that specialized in managing digital film assets to create interactive special effects for the movie industry; MITEM Corporation, which provides legacy integration to government and healthcare; and iManage, a content management solution for the Fortune 500.