
This paper presents methods for production forecasting that give reasonable post-treatment predictions that have been found to be useful for economic planning. The proposed methodology provides an economically viable plan for optimizing lateral length, fracture spacing, and treatment design. The methodology focuses on the post-simulation effective reservoir volume. Results show that increasing apparent fracture length rarely affects long-term recovery. Likewise, adding more fractures within the same reservoir volume may increase early-time production rate and decline rate without contacting more reservoir volume or adding to long-term recovery.
Introduction
Industrywide, there appear to be several basic assumptions that govern expectations about recovery generated through horizontal-well stimulation in unconventional reservoirs. Depending on the basic belief system applied, dramatically different, even diametrically opposed, recommendations result. The first belief is that core-derived permeability values, usually from crushed samples, represent overall reservoir flow capacity accurately. This assumption frequently controls post-treatment expectations regarding treatment size, spacing of perforation clusters (fracture-initiation points), or number of treatment stages and most significant aspects of completion design. However, core permeabilities do not represent the overall reservoir flow capacities, something that diagnostic fracture injection tests (DFITs) or production analysis does achieve by measuring the integrated-system permeability, including any secondary fracture enhancement, including existing natural fractures and shear and extensional fracture enhancement developed during the stimulation process.
The assumption that crushed-core-derived matrix permeability describes the system flow capacity is generally accompanied by the industry’s second belief, that created or seismically imaged fracture length represents the effective flowing length of the hydraulic fractures. The combination of these two beliefs is used by the industry to explain the observed production behavior in many models. In other words, belief in one requires belief in the other. However, field observations and many years of laboratory work strongly support the conclusion that effective fracture length is much smaller than the created or imaged length and that fracture cleanup is driven by the reservoir flow capacity. In very-low-permeability and low-pressure systems, the effective fracture length is limited by cleanup (flowing length) rather than by conductivity.
Cleanup Mechanisms and Fracture Effectiveness
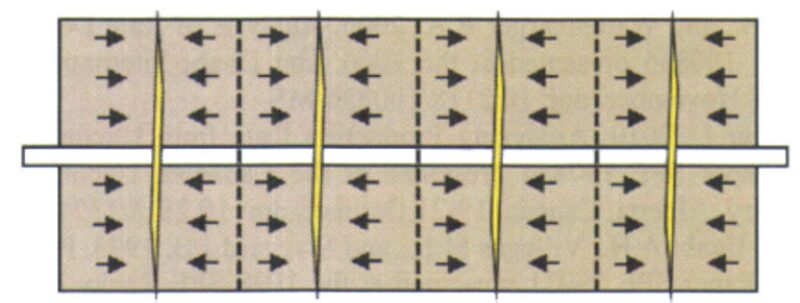
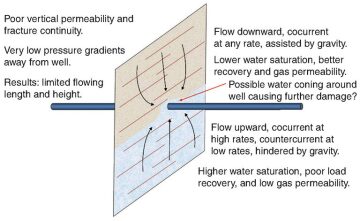
Fig. 1 shows the expected configuration of a transverse fracture in a horizontal well. At shutdown, the fracture is full of fracturing fluid, generally water, assuming that a slickwater treatment has been conducted. When drawdown is applied to the system, gas or oil enters the fracture and moves to the wellbore, where it can be produced. Hydrocarbon (HC) entering the upper section of the fracture, above the lateral, flows downward along with the fracturing fluid, assisted by gravity drainage. Flow of HC and water are cocurrent, and water is held up only by relative permeability and capillary forces. Final residual water saturation in this fracture limb is expected to be low, and the ultimate HC permeability will be high. HC entering the lower limb of the fracture must overcome the capillary entry pressure and will then begin to move at saturation greater than the critical saturation of the nonwetting phase in the proppant pack. If the HC migrates at low saturation, its permeability will be small and the water relative permeability will remain high. Therefore, liquid displacement from the lower fracture limb is expected to be inefficient, which results in very low load recovery and poor effective HC conductivity.
Experiments were conducted to investigate this phenomenon. These experiments consisted of vertical upward and downward cocurrent and countercurrent flow over a range of potential gradients and velocities. Load recovery, pack saturation distribution, and effective conductivity have been determined for various conditions. The experimental results confirmed the expected adverse producing condition of the lower limb of a vertical fracture.
Decline-Curve vs. Rate-Transient Analysis
With the understanding that effective fracture length in unconventional reservoirs may be limited, a method must be developed to forecast production decline and derive economic value of a given completion design. The methods currently available and most widely used include decline-curve analysis (DCA) and rate-transient analysis (RTA). A method must then be developed to predict the performance of a horizontal well with multiple interfering fractures so the fracture size, fracture spacing, and overall well design can be evaluated.
Methods used to determine estimated ultimate recovery and in-place reserves are based on conventional reservoir-performance assumptions. In unconventional reservoirs, these assumptions may not be valid or may only be valid so late in the reservoir life as to be useless. To be used effectively for prediction of future performance, the decline-curve model must assume that the current flow regime will continue through the forecasting period. The decline-curve extrapolation also requires that the reservoir be in pseudosteady-state or boundary-dominated flow, producing at capacity, and producing at constant bottomhole flowing pressure. In general, unconventional reservoirs are not producing under pseudosteady-state conditions and may not adhere to the remaining assumptions. For permeability in the range of several hundred nanodarcies, the decline-curve extrapolation will not be valid until after approximately 100 years of production. As a result, only RTA, which can allow for variable flowing pressure and transient flow regimes, holds some hope for a valid result.
Application of the Linear-Flow Model
A popular and commonly used model used by many companies for forecasting the performance of a multiple-fractured horizontal well is the linear-flow model proposed by Arevalo-Villagran et al. in their 2001 paper “Some History Cases of Long-Term Linear Flow in Tight Gas Wells.” Several mechanisms are presented that can lead to apparently linear-flow behavior, including infinite-conductivity fractures extending to the drainage-area boundary, anisotropic reservoir-system permeability, or linear deposition channels. While all of these are possible, for some reason, the industry has, in general, taken the first mechanism (infinite-conductivity fractures with no inflow beyond the fracture tips) as the reason for the presumed linear-flow signature observed in some production analyses. This is probably the least-realistic and -acceptable cause for any linear-flow signature.
The common application of this technique is based on two important and limiting assumptions: (1) that flow is linear and normal to the face of induced hydraulic fractures, the fractures have high conductivity, and no production is derived from beyond the tips of the fractures; (2) that a straight line on the plot of pseudopressure drawdown divided by flow rate vs. equivalent flow time always indicates a linear-flow regime.
Fig. 2 above shows the assumed flow geometry for this model. The model is popular because it predicts reservoir permeability values that are consistent with crushed-core permeability measurements in shale and predicts that production can be improved significantly with much larger fracture treatments. The assumption that fracture conductivity is not a limiting factor also drives stimulation choices to slickwater fractures with low concentrations of small proppants. These assumptions, especially the required fracture length to support production from such low permeabilities, are totally inconsistent with field observations and the more than 25 years of laboratory work conducted by the Stim-Lab Proppant Consortium to understand flow and cleanup of proppant packs under realistic field producing conditions. Everything known about multiphase flow in propped fractures strongly indicates that the assumed flow geometry is not physically possible. The assumptions of the model lead to incorrect interpretations of production performance and ineffective stimulation and development planning.
This paper proposes a different model, which assumes a reservoir enhanced permeability consistent with DFIT results and a fracture length consistent with all the physics currently understood about fracture cleanup and conductivity. In this case, the pressure transients from adjacent fractures will begin to interfere early in the producing life. As the drawdown areas coalesce, a linear drainage pattern forms, with flow from the reservoir to the combined fractures and lateral. In this case, the assumed linear-flow period represents the formation linear flow rather than the fracture-face linear-flow regime.
Suggested Method for Determining Optimum Fracture Size and Spacing
On the basis of the evidence that the production from a system of interfering fractures on a lateral well can be predicted with available methods, once the average reservoir and fracture properties are defined, it is possible to develop a consistent methodology to optimize horizontal-well-treatment design. The method is to describe statistically reservoir kh (product of permeability and thickness), drainage area, aspect ratio, and effective fracture length for historical wells on the basis of DFITs, production analysis, or history matching with an appropriate simulator. Once these parameters have been fixed, or described over a statistical distribution in case the method is applied to Monte Carlo analysis, then the production from a lateral with any number of similar fractures can be predicted. This requires that the following assumptions can be made: All fractures will behave similarly; system permeability can be determined from a properly designed, conducted, and analyzed DFIT; drainage area can be estimated from observed production data; and effective fracture length can be estimated from available reservoir producing conditions and experimentally supported fracture-cleanup data.
Once the best fracture design has been determined for a single fracture on a vertical well, one should run production-decline forecasts for the specified lateral length and a range of transverse-fracture spacing, accounting for overlap of fracture drainage areas and time to interference of adjacent fractures. Next, one computes the net present value (NPV) for 5 years of production, with an assumed product price and discount factor, including the drilling and completion cost for each case to identify the highest-value completion design.
The biggest uncertainty in this analysis is the expected drainage area that each fracture can contact. Geologic complexity, stratigraphic permeability boundaries, grain-size variability, clay content, wettability, and other factors not discernible from log, core, or seismic data can create limited drainage compartments within a resource volume. A practical effective economic limit to the useful drainage area of a fracture can be estimated by use of the radius-of-investigation equation and the system (DFIT) permeability.
Once system permeability and static reservoir pressure are defined from direct field measurements, preferably DFIT analysis, the NPV of production derived from various propped-fracture lengths, and therefore job costs, can be determined by a production model tied to an effective-fracture-cleanup simulation.
When the incremental cost of the additional fractures and the increased decline rate are incorporated in the NPV calculations, a different picture can emerge. Considering the rapid changes in drilling and completion costs, it may be more effective to examine the discounted present value of production using a required internal rate of return, or discount rate, to determine optimum completion design.
The optimum number of fractures will obviously depend on gas price and treatment costs, and possibly economics of scale, allowing a decreased cost per fracture with more-efficient multistage-completion designs. It is also worth noting that the maximum NPV is generated in approximately 5 years of production. In general, comparing NPV after 5 years is the best way to identify the optimum completion value for most unconventional reservoir systems.
This article, written by Special Publications Editor Adam Wilson, contains highlights of paper SPE 168612, “Economic Optimization of Horizontal-Well Completions in Unconventional Reservoirs,” by R.D. Barree, SPE, Barree & Associates; S.A. Cox, SPE, PetroEdge Energy III; J.L. Miskimins, SPE, and J.V. Gilbert, SPE, Barree & Associates; and M.W. Conway, SPE, Core Laboratories, prepared for the 2014 SPE Hydraulic Fracturing Technology Conference, The Woodlands, Texas, USA, 4–6 February. The paper has not been peer reviewed.