
Tropical storms severely affect oil and gas production in the Gulf of Mexico, especially during the storm season from June to December. Offshore well managers often need to shut down operations and evacuate the facility because of storm alerts. Furthermore, if the storms have a more-severe effect, facilities may need to be repaired before production restarts. The purpose of this paper is to determine the effect of storms on production by quantifying metrics such as downtime days and downtime percentage after the storm has passed and whether a facility’s platform type affected these metrics.
Introduction
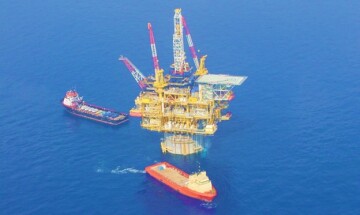
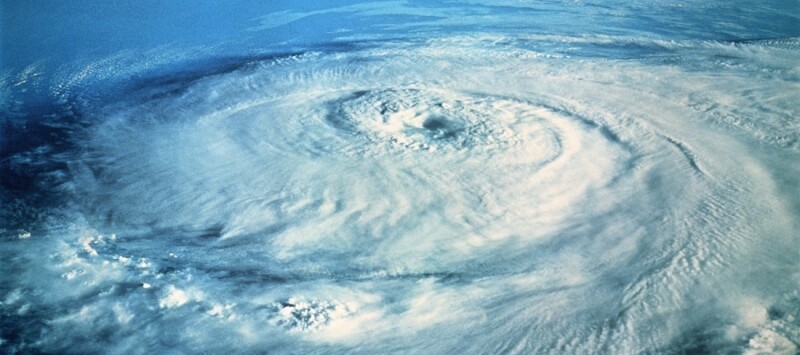
Oil and gas production at offshore facilities (Fig. 1) are severely affected, especially in the Gulf of Mexico, by frequent storms. Approximately 12% of all storms occur in the Atlantic Basin, which includes the Gulf of Mexico. The hurricane season in the Atlantic Basin, between June and November, causes estimated losses of up to $850 million per storm in terms of barrels of oil equivalent (BOE) production for all the wells in the Gulf of Mexico.
Table 1 summarizes the estimated median damage caused by hurricanes during the past century as a function of wind speed to highlight storm effect.
| Storm Category | Median Damage (million USD) | Damage Ratiob |
| 0 | <1 (118)a | 0 |
| 1 | 33 (45) | 1 |
| 2 | 336 (29) | 10 |
| 3 | 1,412 (40) | 50 |
| 4 | 8,224 (10) | 250 |
| 5 | 5,973 (2)c | 500 |
| Table 1—Hurricane Damage as a function of wind speed where (a) is the number of cases shown in parenthesis, (b) is the damage ratio providing a reference value for median damage, and (c) is the median damage for Category 5 hurricanes, which may not be representative of the true amounts because of the small sample size. | ||
The loss in production volume from storms also depends on the type of platform used. Offshore platforms are made of steel, reinforced concrete, or a combination of both and are designed for exploration and extraction of oil and gas in open sea, lakes, and gulfs. Different types of platforms are used depending on water depth. In the Gulf of Mexico, the following types of platforms are currently under operation: compliant towers (CTs); fixed platforms (FPs); floating production, storage, and offloading vessels (FPSOs); semisubmersible floating-point subsystems (FPSs); and tension-leg platforms (TLPs).
Fig. 2 shows a schematic of each of these offshore platforms. The infrastructure of a platform, its depth, and its location will determine the level of effect from storms and the effect on oil and gas production after a storm.
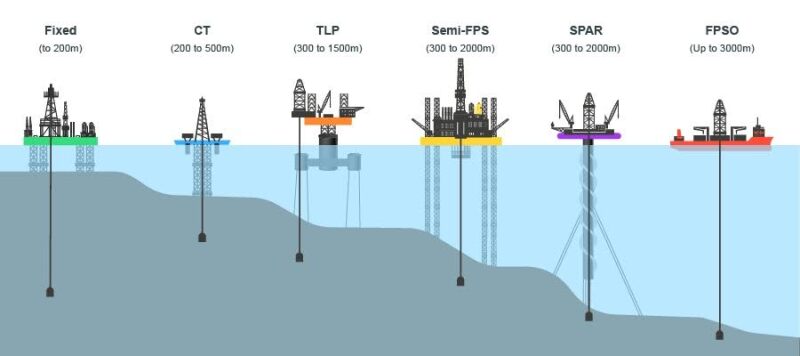
This study focuses on determining whether a correlation between the type of platform and damage caused by storms exists by calculating an overall percent of downtime of wells in the Gulf of Mexico.
Literature Review
To assess the significance of this study and support its hypothesis, a study based on the effects of hurricanes Katrina and Rita was analyzed. The prolonged effect of hurricanes Katrina and Rita in 2005 reduced the production of crude oil and natural gas by 162 million bbl and 784 Bcf, respectively, which constituted approximately 30% and 21% of annual oil and gas production from federal offshore wells, respectively, 9 months after the storms. Katarina’s effect in Louisiana forced refineries to shut down, reducing refinery capacity by nearly 2 million B/D through direct damage and power-supply interruptions. The US Energy Information Administration estimated a 4.9 million BOPD production effect, which accounts for 29% of the US refining capacity and more than 60% of the Gulf Coast region’s refining capacity.
The expected path of the storm is a factor affecting oil production by causing oil production and transport in the Gulf of Mexico to shut down. The Outer Continental Shelf (OCS) had more than 40,000 wells drilled from 1947 to 2007, 4,000 structures, and 33,000 miles of pipelines. In 2003, 25% of nationwide oil and gas supply for US came from the OCS, estimated to be 1.5 million bbl of oil and 14.5 Bcf of natural gas.
Hurricanes Gustav and Ike severely damaged 60 platforms in 2008 after affecting 2,127 out of 3,000 oil and gas platforms in the Gulf of Mexico. These platforms produced 13,657 bbl of oil and 96.5 Mcf of natural gas every day, accounting for 1.05% and 1.3% of oil and gas production, respectively, in the region.
Finally, according to another study that analyzed the effect of a storm in the US Gulf Coast across various platforms, FP structures were determined to be the quickest to get back online after a storm, which was 48–72 hours after evacuations. On the other hand, floating production systems in the deepwater region could take up to a week to resume operations. The transportation cost of crew members alone because of unscheduled weather-related evacuations adds approximately $10,000 per production facility and $50,000 per drilling rig over normal transportation cost.
Data Sources
The study used two data sets, one for production data and the other for weather data. Production data was obtained from several sources including RS Energy, IHS Markit, and the Bureau of Ocean Energy Management. The combined data consisted of well metadata, monthly BOE production, and infrastructure type along with geographical coordinates of wells in the Gulf of Mexico. Overall, the production data set tracked 610 wells monthly from 1996 to the first quarter of 2020. This data was merged with the weather data from the National Hurricane Center, containing storm details with their intensity, the path followed at different times, and the storm’s status derived based on its wind intensity. Data for 1,506 storms since 1900 was aggregated on a daily level.
Storm data was aggregated on a monthly level with the assumption that a month after the storm will show an effect on the BOE production. However, this may not always be the case.
Tropical storms that affected oil and gas production were of greater importance. Similarly, platforms such as FPSOs, semi-FPS, and spars, where storms hit production harder, were observed more.
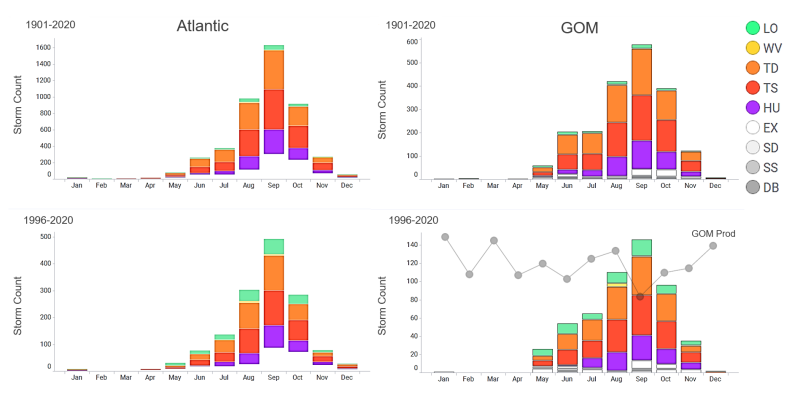
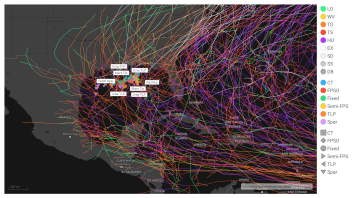
Fig. 3 displays all storms with their trajectories in the Atlantic that occurred from 1900 to the first quarter of 2020. The tropical storms are colored using a color palette, and the nontropical storms are colored in shades of gray and white.
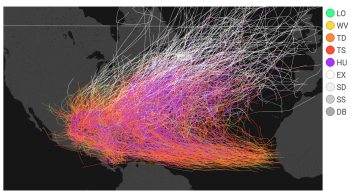
Merged data showed that storms mostly occur during hurricane season, from June to November in the Atlantic. The number of storms peaked in September consistently from 1900 to 2020, which can be directly correlated with maximum effect on production in the Gulf of Mexico during September, as shown in Fig. 4.
Analysis
To assess production downtime, storm data was limited for only 1996 to the first quarter of 2020, to match the range of available production data. The focus of the study was to determine metrics to assess storm effect for which production data was a necessity. The goal of Figs. 3 and 4 was to distinguish a storm pattern difference and frequencies of storms in the case of any and establish credibility for weather data in the range of 1996 to the first quarter of 2020 independently in order to soundly eliminate all prior historical data.
With the understanding that only storms with a direct trajectory within the Gulf of Mexico are likely to have an effect on production while the rest will not, the storm data set was further limited to a 500-mile radius from the southern-central well, as illustrated in Fig. 5. The outcome of these limitations was a data set with 161 storms, out of which 115 were classified as tropical storms between 1996 and the first quarter of 2020.
Production and weather data sets were merged to determine whether an occurrence of a storm caused major fluctuations in production.
Percent Downtime
Fig. 6 illustrates the process of calculating percent downtime. Percent downtime is essentially the variance between the observed production during a storm month (indicated by a blue bar) to the expected production in that month in the absence of a storm (indicated by a red line). The first step in determining percent downtime was identifying all months for a given year that contained a storm between 1996 and the first quarter of 2020 (indicated by a gray bar).
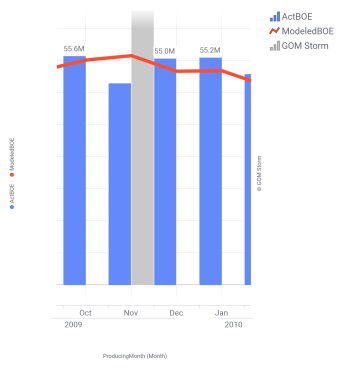
The simulated BOE during a storm month was determined to be equal to the BOE of the preceding month with no storm based on the assumption that, if no storm had occurred, the well would have continued to produce at similar levels as the prior month. The change between the simulated BOE and the actual BOE is the percent downtime for the month.
This process was replicated across the entire data set for 610 wells across all months from 1996 to the first quarter of 2020 resulting in a total iteration of 124,394 times. Fig. 7 summarizes the results of percent downtimes for each infrastructure for a specific month based on all available data with a P10, P50, and P90 percentile case.
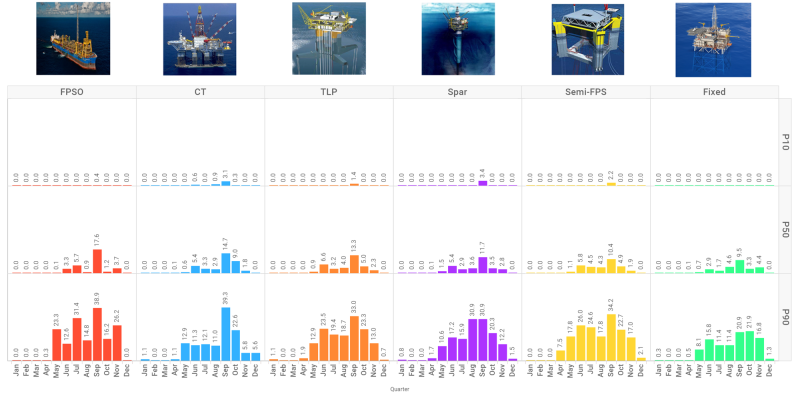
As Fig. 7 illustrates, for all infrastructures and all percentile cases (P10, P50, and P90), percent downtime is the highest in September, indicating the worst effect on production during that month. It is also observed that platform types FPSO, CT, TLP, and spar have the worst median production effect in September in that order, with 17.6%, 14.7%, 13.2%, and 11.7%, respectively, as shown in Fig. 8, while the lowest percent downtime is observed by an FP. The P10 and P90 values of these infrastructures also show similar results.
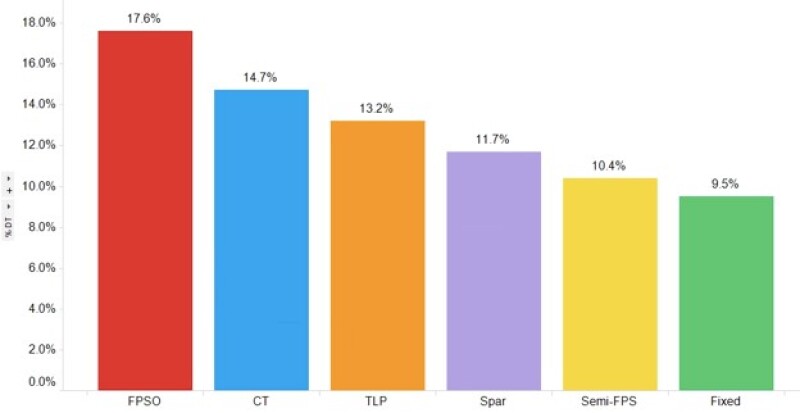
FPSOs in the Gulf of Mexico operate in water depths of 3000 m, while FPs are the shallowest at only 200 m deep. This very well could play a role into the production effect of storms. FPSOs are in deeper waters, where the storm intensity is higher compared with FPs, where the storm intensity would decrease as it came closer to landfall. An additional factor for increased downtime for FPSOs is its inability to connect to risers and subsea systems until logistical criteria related to inspection and ocean are met.
Percent downtimes in the Gulf of Mexico region have similar results, with September being the month with the highest anticipated downtime while December to April are the calmest months with very minimal chance of effect to production because of weather. Table 2 summarizes the monthly percent downtime for the Gulf of Mexico. It is notable that September not only has the highest percent downtime but also the P10 scenario, which estimates a best case of 0% downtime for every month in the year, including hurricane season, has an estimated 1.47% for September, highlighting the unlikelihood of a 0% downtime because of the high frequency of storms in September.
| Month | P10 | P50 | P90 |
| Jan | 0.00 | 0.00 | 0.59 |
| Feb | 0.00 | 0.00 | 0.00 |
| Mar | 0.00 | 0.00 | 0.00 |
| Apr | 0.00 | 0.00 | 2.03 |
| May | 0.00 | 0.97 | 11.72 |
| Jun | 0.00 | 4.78 | 19.59 |
| Jul | 0.00 | 2.88 | 17.49 |
| Aug | 0.00 | 3.92 | 17.07 |
| Sep | 1.47 | 11.39 | 30.57 |
| Oct | 0.00 | 4.05 | 21.70 |
| Nov | 0.00 | 2.84 | 14.59 |
| Dec | 0.00 | 0.00 | 1.19 |
| Table 2—Gulf of Mexico monthly downtime percentage. | |||
Overall, the median downtime percent for the Gulf of Mexico was determined to be 4.2%, with all percentiles summarized in Table 3. Based on the results, it is recommended to plan a time-dependent percent downtime because a very clear trend has been established between the time of the year and the storm activity. It is also recommended to take into consideration the platform depth because deeper platforms, such as FPSOs, will see a greater effect compared with shallower structures such as FPs, presumably because of storm intensity and safety logistics.
| P10 | P50 | P90 | |
| GOM | 1.7% | 4.2% | 8.7% |
| Table 3—Annual downtime percentage in the Gulf of Mexico. | |||
The limitation of this process is that, because the simulated BOE data is calculated on a monthly basis only because of data availability, it was assumed that the effect of a storm on production data is seen a month after the storm, which may overshadow production effect on a daily level.
Downtime Days
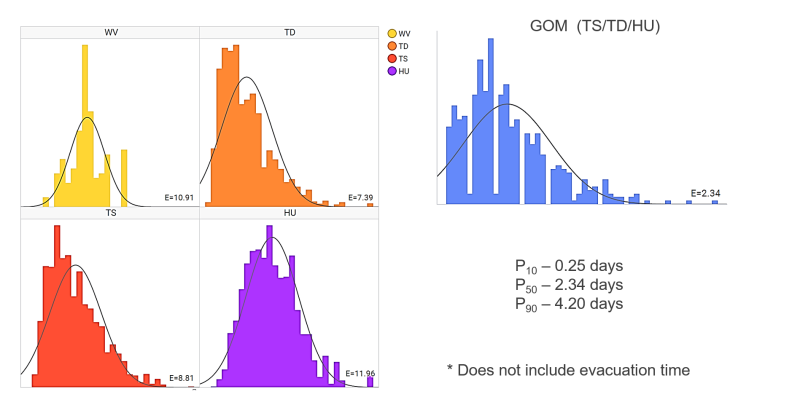
The calculation of downtime days assumed that the number of downtime days will equal the number of days a given storm was active. This assumption is sound because, at a minimum, a platform will be shut in for the days a storm is in session, without accounting for factors such as evacuation time, repair time, or time to bring the well back online. Because these factors are not considered in the calculation, the actual downtime days may be much higher. The difference was calculated between the start and end time of each storm, resulting in a range of downtime days across the Atlantic and for each storm type. A confidence interval was calculated for the downtime days with the P10, P50, and P90 method to obtain lower, median, and upper estimates of downtime days. The median downtime days for a tropical wave was 10.91 days, for a tropical depression was 7.39 days, and for a tropical storm was 8.81 days, as illustrated in Fig. 9. Hurricanes caused the most median downtime days at 11.96.
The median amount of days a storm remained active within the 500-mile radius was determined to be 2.34 days. This calculation, however, excluded evacuation time based on weather warnings received by well managers. Typically, evacuations cause delays of 48–72 hour for an FP and up to a week for FPS platforms.
Summary
The study determined the effect of storms on oil and gas production in the Gulf of Mexico. Percentage downtime and downtime days were the metrics that were considered for this calculation. Production data sets were combined with weather data to determine effect on production from hurricanes depending on the structure type of each platform. The median downtime days in the Gulf of Mexico was determined to be 2.34 days (Fig. 9), and its median downtime percent was 4.20% (Table 3). FPSOs showed the highest median downtime in the month of September, when most storms occurred, while an FP had the lowest percent downtime.
For planning purposes, it is recommended not to plan for a fixed percent downtime because there is a very clear correlation between the month of the year and the number of storms observed and their direct effect on production. For example, the highest storm month, September, sees the lowest production numbers. To account for the most-active storm months of the year—June to November—a higher percent of downtime should be allocated to these months for more accurate accounting. As well, there is a relationship established between the type of platform and the percent downtime, with FPSOs showing the highest percent downtime compared with the rest in September. This is likely because deepwater operating structures such as FPSOs experience a greater effect compared with shallower structures such as FPs because of storm intensity and deepwater-related safety logistics. The type of platform, as well, should be taken into consideration when planning for percent downtime.
Future Scope
This data can be used for models to find out seasonal effects of hurricanes or even monthly effects of the metrics of downtime percent and downtime days. Proximity of the storm to a well, the strength and the speed of the storm, and the kind of platform that the well is built on also can be considered for such models. Additional assumptions, however, may also be needed.
The availability of weather data being on a daily basis and production data being on a monthly basis can cause uncertainty in a model built to determine the key metrics of downtime percent and downtime days.