In 2019, the oil and gas industry experienced 25 deaths among member companies of the International Association of Oil and Gas Producers (IOGP), according to a recent report by the organization. This compares with 31 fatalities in 2018.
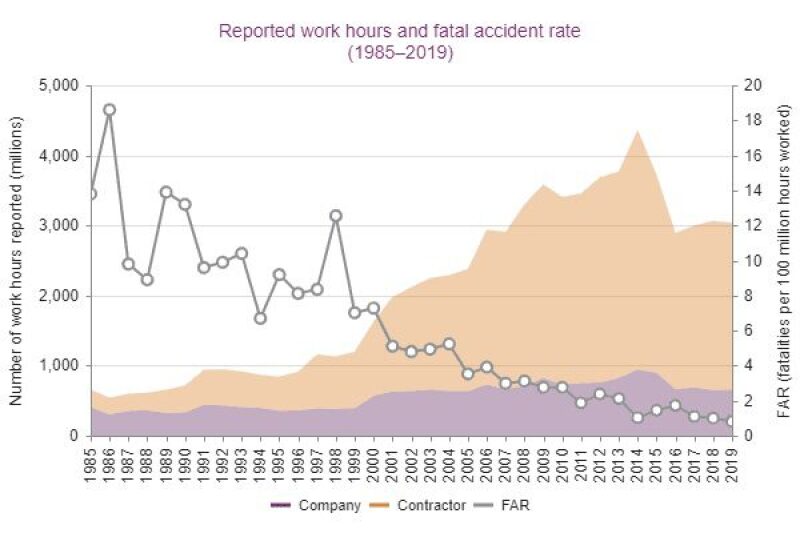
The report says that that fatalities in 2019 were the result of 22 separate incidents during the course of approximately 3 billion work hours. The number of work hours for 2018 was similar to 2019, resulting in a statistically valid reduction in the fatal accident rate (FAR) of 19%. In 2018, the FAR was 1.01 deaths per 100 million hours worked; in 2019 the FAR was 0.82 (Fig. 1). The FAR for oil and gas companies was about half that for contractors.

Fig. 1—Reported work hours and fatal accident rate from 1985 to 2019.
Looking at fatality causes, the largest proportion of deaths was attributed “caught in, under, or between” incidents, which excludes those involving dropped objects. Twelve such fatalities resulted from 10 separate incidents. Among IOGP member companies, incidents involving lifting, crane, rigging, and deck operations were the main cause of deaths, accounting for six fatalities.
Data reported by IOGP members also recorded a fall in the total recordable injury rate (TRIR). 2019 saw 0.92 injuries per million hours worked. In 2018, the TRIR was 0.99.
More specifically, the overall lost time injury rate was 0.24 per million hours worked in 2019, 8% lower than 2018’s 0.26 injuries per million hours worked.
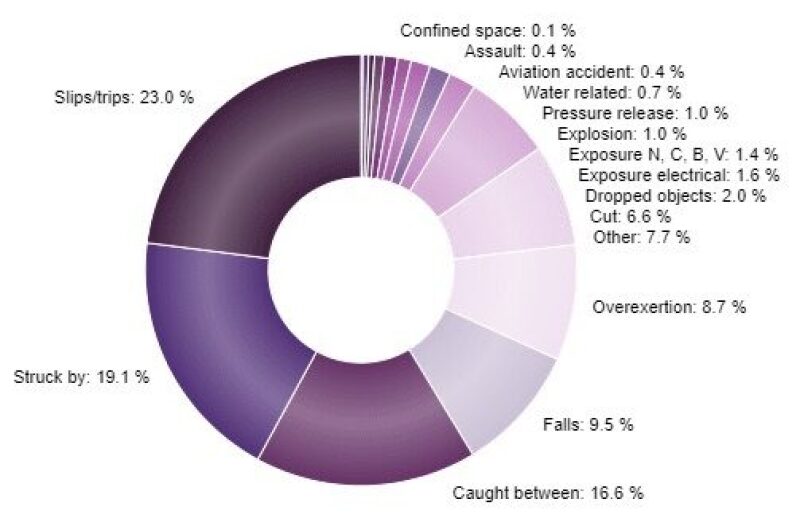
IOGP member companies that participated in the study reported 703 lost work day cases (LWDC) in 2019. Of these, 551 incidents involved contractors and 152 incidents were oil and gas company related. In both categories, the greatest number of incidents were slips and trips (at the same height), accounting for 23% of the total (Fig. 2).
Overall, participating companies reported 21,899 days of work lost through injuries.

Fig. 2—Percentage of LWDC by cause in 2019.
“IOGP’s data series are critical for us to help define focus areas for improvement,” said Olav Skar, IOGP’s safety director. “Whilst a reduction in the key safety performance indicators measured is always welcome, we are only one major process safety or helicopter incident away from reversing the improving trend. Our work is not done until we reach zero and know we will stay there.”
IOGP’s annual safety performance indicators report is part a larger effort that involves the collection of data from participating member companies and their contractors on worldwide upstream operations.
The Data Series encompasses safety (with specific focus on occupational, process, land transport and aviation), environmental performance and health. Based on this information, IOGP then produces a series of annual reports that have been an authoritative source for upstream operators as well as a wider public that includes regulators, legislators, and other interested parties.
Find the full IOGP Safety Performance Indicators—2019 Data report here.

