The one-two punch of COVID-19 demand destruction and a Saudi-Russia price war has left North American oil and gas operators reeling. Shutdown of production at the wellhead has begun in earnest, with virtually no upstream operator or basin left unaffected.
Despite the obvious gloominess of the current state of the oil and gas industry, an interesting reservoir characterization opportunity now presents itself to those exploration and production companies (E&Ps) that are looking for a silver lining: the collection of downhole buildup data on temporarily shut-in wells.
In this article, I describe how the pressure buildup—a well-testing technique that has been relegated to obscurity in the face of 15 years of fast-paced shale resource development—can complement existing methods and workflows that rely heavily on flowing data for reservoir characterization, or rate transient analysis (RTA).
Potential benefits with high return on investment (ROI) abound, including confirmation of hydrocarbons in place, identification of accumulated productivity loss, interference detection/quantification, and high-resolution fracture characterization.
In the Beginning, There Was PTA
The common “ancestor” upon which all well-testing techniques are based, including RTA, is the constant-rate drawdown. This represents the confluence of theoretical and practical in the world of pressure transient analysis (PTA)—a simple experiment whereby rate is held constant and the flowing pressure response is measured. The pressure buildup (PBU) test is an ingenious extension to the drawdown and can be thought of as a mirror image of the preceding drawdown test.
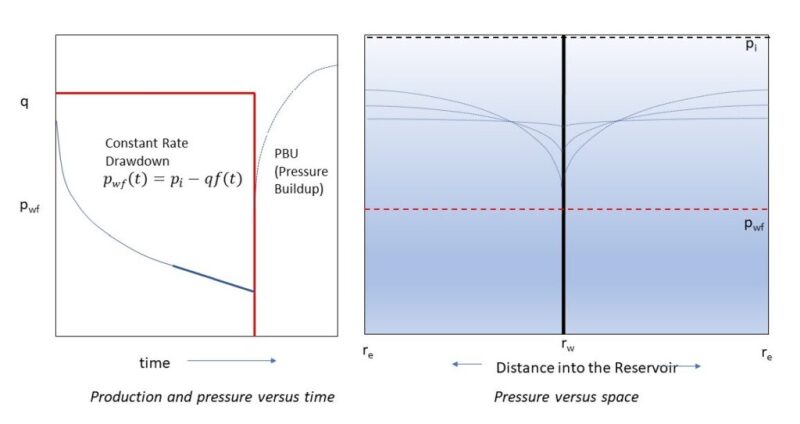
Illustration of a simple drawdown and buildup. Source: Saga Wisdom
A drawdown test on its own has limited appeal, but the combination of drawdown followed by a pressure buildup is very valuable. The reason for this has nothing to do with PTA theory. The drawdown equation covers everything we need.
In fact, the PBU doesn’t even have a mathematical solution; its application requires the principle of superposition—a production and injection rate of equal magnitude resulting in a net “zero” rate.
So why do we go through the trouble of measuring and analyzing buildup pressures at all? The reason is simple: the drawdown response is subject to disturbances (fluid flowing through pipes is noisy), making it difficult to control and analyze.
By contrast, the buildup response is clean and quiet.
Imagine there is someone in a room with the door closed and the TV volume turned up all the way. They are whispering and you are on the other side of the door trying to hear what they are saying. That is the drawdown test. There is a reservoir signal—the whispering—but it is very hard to hear it over the noise.
In this analogy, a PBU test is like opening the door and turning the TV off. The whisper is the same, but now you can hear it much more clearly.
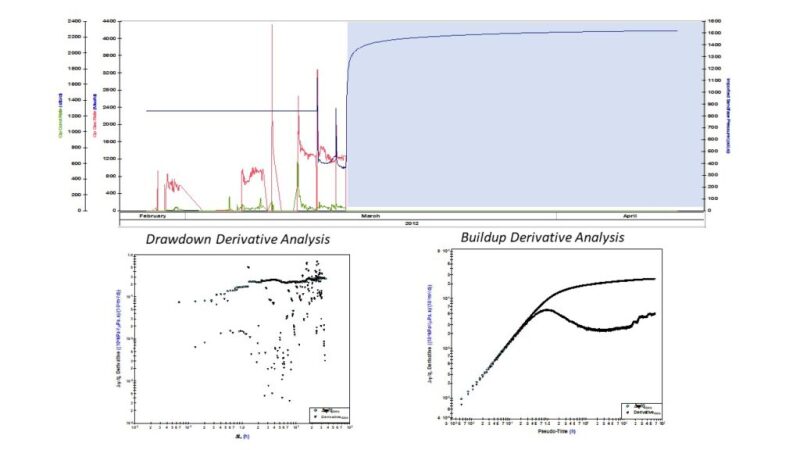
Example flow and buildup test with derivative analysis. Source: SAGA Wisdom/IHSMarkit Welltest Software
The Age of RTA and Unconventional Resources
To understand the unique opportunity E&Ps currently have during this exceptional episode, it is worth taking a look back at how the science and practice of well testing has evolved into the more economical practice of RTA (at least in onshore North America) over the past 20 years.
Twenty-five years ago when I started my career, virtually every new well in Canada was tested using some form of single or multipoint flow and buildup test (similar to the figure shown above), usually on a portable test separator. These tests were not cheap, but they provided a wealth of high-resolution information about the reservoir. Upon completion of the test, wells were tied in and placed on production, at which point the ensuing flowing data were largely ignored, at least by the well-testing community.
The idea of applying PTA techniques to production data was not new—Fetkovich laid the foundation for it in the late 1970s. Authors including Blasingame, Wattenbarger, and Agarwal (to name a few) contributed importantly to the literature.
Nevertheless, RTA was mostly academic and unknown to most operators until the early 2000s. At that time, practical PTA-based production analysis gained a foothold, primarily due to three factors:
- Realization that production data contain valuable information about the reservoir that cannot be obtained from a short-duration test. Because of the extended time element, RTA provides insight into boundary-dominated flow (not attainable from initial PBU tests), thus helping to characterize drainage volume and in-place hydrocarbons.
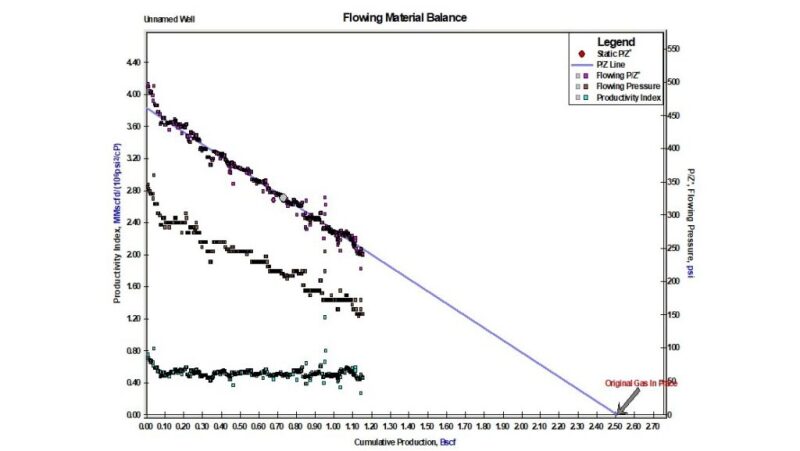
The flowing material balance—a popular RTA technique. Source: Saga Wisdom/IHSMarkit Harmony Software
- Industry progression toward unconventional resources, rendering conventional buildup tests impractical, required shut-in times for buildup tests that are inversely proportional to reservoir permeability. The feasibility of these tests for early characterization of reservoir properties in sub-microdarcy reservoirs becomes highly questionable.
- Thanks to an increased accessibility to data and software tools for application of RTA, the ROI has become nearly infinite as the cost to acquire data and analyze it is very low.
The past 15 to 20 years has seen a steady evolution in the way petroleum engineers use well-performance data to characterize reservoirs and make better decisions regarding field development. This evolution has been shaped by the external restriction of uninterrupted production under uncontrolled (from the analyst’s perspective) conditions, combined with the gradual disappearance of conventional flow and buildup tests in onshore North America.
Contemporary petroleum engineers are rarely given the opportunity to implement a controlled rate or pressure test that has been designed to fulfil a specific set of requirements. In spite of these restrictions, we have done remarkably well as an industry, using RTA as a “hammer” to hit home a wide assortment of “nails,” some of which include reserves evaluation, production surveillance, production optimization, completion benchmarking, and well-spacing evaluation.
We’ve Come Full Circle
The exposure we currently face as reservoir engineers is that our collective understanding of the subsurface over the past 2 decades is heavily weighted to RTA, because our “laboratory” has consisted of wells essentially on continual production.
A petroleum engineering consultant, Dwayne Purvis, advises everyone to think of this problem as being similar to having hundreds of photographs of a building but all of them were taken from the same vantage, giving the same perspective. Without pictures from other vantage points, he points out that we are missing information about that building.
Interestingly, a PBU conducted inline, after months or even years of production on a tight, fractured oil or gas well can provide some of the missing perspective that cannot be captured from RTA’s vantage. Some key pieces of information that such a PBU provides are:
- Better resolution. Remember the analogy of the closed room with the noisy TV? A PBU can provide a much clearer and more detailed picture of the near-wellbore and fractured region. This additional knowledge complements the low-resolution, but farther-reaching RTA characterization, providing additional constraints for non-unique RTA models and thereby improving confidence.
- Identification of productivity loss. All wells suffer from some degree of productivity loss (reduction of the stabilized productivity index over time). All other things being equal, the longer a well is on production, the more productivity loss it will suffer. With RTA, it is notoriously difficult to decouple reservoir depletion from productivity decay, especially if production and flowing pressure decline are reasonably smooth (this applies to hundreds of thousands of wells). An inline PBU can quickly identify and quantify this productivity loss, as well as its source to some extent (i.e., a PBU can distinguish increased damage skin from reduced permeability).
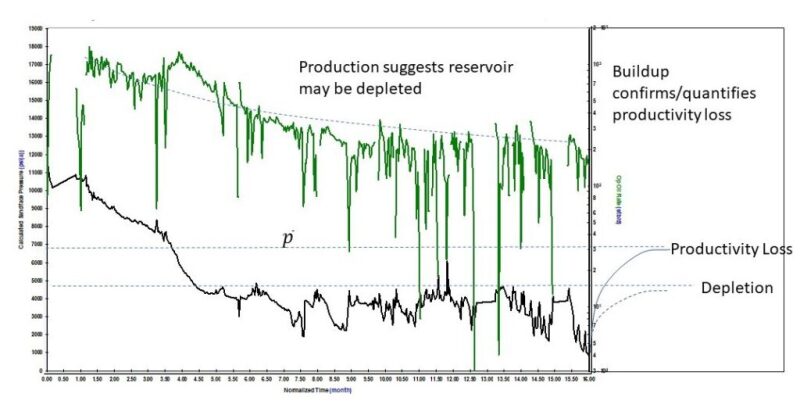
Illustration of PBU confirming productivity loss against hypothetical RTA depletion assumption. Source: Saga Wisdom
- Confirmation of average reservoir pressure and hydrocarbons in place. As pointed out in point No. 2, RTA has trouble distinguishing between reservoir depletion and productivity loss. As a result, RTA tends to err on the side of depletion, often understating true accessible hydrocarbon pore volume. An inline PBU, if the well is shut-in long enough, can confirm average reservoir pressure, often revealing additional oil in place not “seen” by RTA. This method is only feasible for the highest permeability range of unconventional resources (e.g., Bakken) and more conventional tight plays.
- Identification of subsurface connectivity among multiple wells. There is no better way to measure interference among adjacent wells—such as on a multiwell pad—than the implementation of a carefully sequenced drawdown and pressure-monitoring schedule, designed to detect interference in a passive (shut-in) well as its neighbor is brought onstream. Such a test can be configured to accomplish this characterization objective as the multiwell pad is being returned to production. One advantage to doing this test after an extended shut-in period (and after significant production has already occurred) is a stabilized reservoir pressure and reduced pressure gradients. Note: This would not be the case at initial conditions as the fracture treatment imposes enormous pressure gradients in the reservoir.
So, now we come full circle, and see the unique opportunity available to E&Ps. Production now must be shut in due to external factors, factors that arose from the same macro-economics that compelled operators against shutting in wells, even for short buildup tests, over the past 15 years!
Making the Most of an Opportunity
As a petroleum engineer, the big question now should be: How do I maximize this unprecedented opportunity to collect quiet pressure data? Of primary consideration, of course, is candidate selection for shut-in. This is driven mainly by factors such as economics and risk (which we have not covered here), where RTA/PTA are secondary considerations at best.
However, the decision of which wells to test and how to test them, from a predefined group of shut-in candidates an operator may have access to, is certainly one that should be informed by RTA/PTA considerations. The following is not an exhaustive list, but provides some important practical factors to keep in mind.
- Reservoir fluid. Most production shutdowns will be in liquids-rich plays as oil is the commodity currently oversupplying the market. Generally speaking, gas-condensate wells (reservoir fluid is gas) will make better test candidates, especially if downhole gauges are not available. The reason for this is the wellbore dynamics in oil wells during a pressure buildup are notoriously unpredictable. Analyzing wellhead pressures on a shut-in oil well is usually not advisable. Even downhole gauge pressures can be problematic as liquid level in the wellbore drops or rises between the gauge depth and sandface depth. When the reservoir fluid is gas, this problem is usually reduced, even with gas-condensate wells that produce significant condensate yields.
- Artificial lift. The presence of artificial lift is usually an inhibitor to pressure testing except in the case of electrical submersible pumps (ESPs). ESPs are already equipped with inflow-pressure recorders that are powered from the surface. Provided the power is not cut, these gauges will go on recording pressures after you shut in the well. Bam! Free buildup test.
- Running downhole gauges. As any reservoir engineer will tell you, the only way to get a high-quality buildup test on a flowing well is to run downhole gauges. There are several reliable and economic options available and any of these will provide great data for your analysis. But here is the important part—make sure you run the gauges before the well is shut in (as far in time before as possible). This will enable the analyst to calibrate flowing pressures that have been measured at the wellhead and corrected to bottomhole conditions to the actual measured gauge pressures, thereby unifying the dataset constituting the PBU and its preceding RTA.
Final Thoughts
I generally do not make predictions, but I will make an exception here. Our industry will recover as it always has in the past. Looking back, we will be thankful as an industry that we took advantage of this unique opportunity to collect data that are normally never available. Among other things, 2020 will be known as the year petroleum engineers dusted off their PTA skills and raised the reservoir characterization bar by combining RTA with inline pressure-buildup analysis.
This may seem like a small point to stress. But big things have small beginnings.
The knowledge gained over the next few months from these embattled assets will pay outsized dividends throughout the entire future of the unconventional sector.