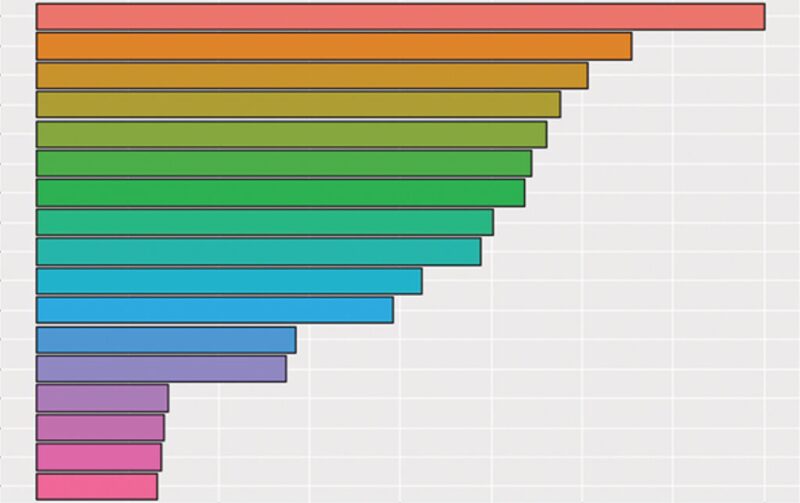
The two most common techniques for forecasting production performance for a new shale well are decline- (type) curve analysis and machine learning. The complete paper describes an automated machine-learning approach to determine the spatial variation in decline type curves for shale gas production, based on existing data of production, completion, and geological parameters. The methodology allows the user to decide whether the focus should be purely on forecast quality or on a combination of forecast and clustering quality. The resulting model will enable the prediction and uncertainty quantification of production profiles for new target wells or areas in the basin.
Methods of Forecasting Production Performance
Decline-curve analysis is the most-popular technique for forecasting production performance in shale formations because of the need for fast decisions.


