
When planning an offshore exploration and production project, operators must consider several potential pitfalls that could derail their progress. Any number of things can turn a hot prospect into a nightmare.
One of the things that can be particularly costly is a class of molecular substances that the average person likely encounters on a daily basis. These molecules, the asphaltenes, are used around the world in city streets, sidewalks, parking lots, roof shingles, and buildings.
However, there is a reason why asphaltenes are often referred to as the “cholesterol of petroleum” (Kokai and Sayegh 1995). The characteristics that make them useful also make them problematic: The solid deposits that result from their agglomeration can plug wells, impair reservoirs, and create difficulties in separation, leading to production interruptions and higher costs.
For many projects, asphaltene management plans are a matter of remediation (the injection of dispersants that break up the solid deposits) or prevention (the application of inhibitors that prevent particle precipitation). The past decade has seen the development of models that predict how asphaltene particles will behave in oil—the conditions under which precipitation, agglomeration, and precipitation occur—and which could lead to more efficient mitigation strategies and lower costs.
The Molecules
Asphaltenes are complex molecules derived from carbonaceous materials such as crude oil or coal and are soluble in benzene and insoluble in low-molecular-weight n-alkanes. In crude oil, they form a colloidal system, carrying an intrinsic charge that may be positive or negative depending on the composition of the oil. The charge attracts resins within the oil to the asphaltene particles. The resins form a protective layer around the particles, creating a combined entity called a micelle.
Asphaltenes precipitate only when the protective resin layer breaks, usually through fluid property variations that take place during the production of oil, such as a change in pressure, temperature, or composition. The precipitates appear as small “primary” particles whose size is generally in the order of a few microns. The primary particles quickly combine to form macroparticles whose size varies depending on the solvent temperature and pressure (Yarranton 2000).
Hydrophilic (having an attraction to water) surfaces such as natural materials like rock and sand found in a reservoir can adsorb solubilized asphaltenes, so deposition is not much of a problem. Hydrophobic (repel water) surfaces, like the metal of a pipeline or a wellbore, are not as likely to adsorb solubilized asphaltenes. Instead, the particles aggregate and adhere to the surfaces, and those deposits of solid material can cause significant problems for operators.
Asphaltenes can deposit at high temperatures because of their colloidal properties, Jefferson Creek said. He is a senior research consultant at Chevron and the chairman of the SPE Flow Assurance Technical Section. Deposition at high temperatures can lead to the fouling of heat exchangers in crude oil, a well-documented problem in petroleum processing.
“Because the asphaltenes represent a large range of chemistries that are present in crude, it is difficult to ascribe this to anything other than the fact that they are dispersed from solution as colloidal particles, which can agglomerate and produce sludge in quiet flow zones and can be captured in the flow boundary layer, creating arterial deposits because of their colloidal nature,” Creek said.
Specialists widely agree upon the composition of asphaltenes as a class. They are made up of hydrogen and carbon in an approximate ratio of 1.2:1 and usually contain a small percentage of other atoms known as heteroatoms such as nitrogen, oxygen, and sulfur. The heteroatoms give asphaltene molecules their polarity and the ability to adhere to each other once they have precipitated (Akbarzadeh et al. 2007).
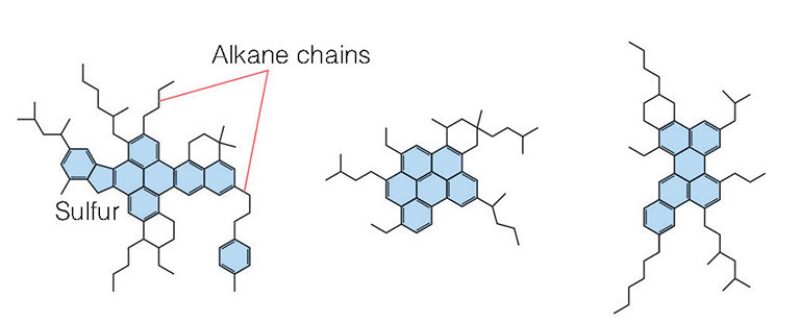
Structurally, however, asphaltenes are still a significant unknown. There are many possible structures (Fig. 1). Some of the hydrogen and carbon atoms are bound in ring-like, aromatic groups that also contain the heteroatoms, while others are contained by alkane chains and cyclic alkanes.
While there is general agreement on the above, the kinetics of precipitation make it nearly impossible to create experimental conditions that can reliably reproduce the same solid material. Creek said this is because asphaltenes do not comprise a single compound.
“If one believes [asphaltenes] reside in the vacuum residuum, then there are millions of species present,” Creek said. “Any serious attempt at compositional analysis or structural determination is almost impossible since there is no monomer or unique unit cell. What is usually produced is a CHNOS (carbon, hydrogen, nitrogen, oxygen, and sulfur) analysis, which is like trying to find an average individual person in Los Angeles.”
The buildup of asphaltene deposits can clog wells, flowlines, separators, and surface facilities, leading to a loss of production. Dispersant chemicals that break up the buildup are a widely used remedy within the industry, and inhibitors help prevent the deposits from solidifying, but the problems asphaltenes present are still costly enough to necessitate the ability to predict their behavior.
Models exist to help understand asphaltene precipitation and phase stability under certain operating conditions: The application of cubic equations of state and equations of state based on the statistical associating fluid theory (SAFT) help with the former, while thermodynamic models help with the latter. However, as Kurup et al. (2012) argue, that is only part of the solution. Predicting how they disperse and deposit on the walls of wellbores and pipelines is equally important. There is no existing testing method in the industry that simulates asphaltene depositions accurately (Alapati and Joshi 2013).
Taras Makogon, principal flow assurance engineer at ConocoPhillips, said a deposition tool would help greatly with projects.
"Asphaltene deposition tools would generally quantify the amount of deposits and, when coupled with multiphase flow tools which would tell us when those deposits would exhibit a measurable resistance to flow, the frequency of interventions. This allows an operator the time to line up the budget, materials, and personnel in a planned fashion, which translates into increased operability, uptime, and profitability," said Makogon, a Flow Assurance Technical Section officer.
ADEPT Deposition Model
A deposition model that has been under development is the Rice University asphaltene deposition tool (ADEPT), which resulted from a collaboration between engineering professors at Rice University in Houston and the DeepStar global research and development consortium.
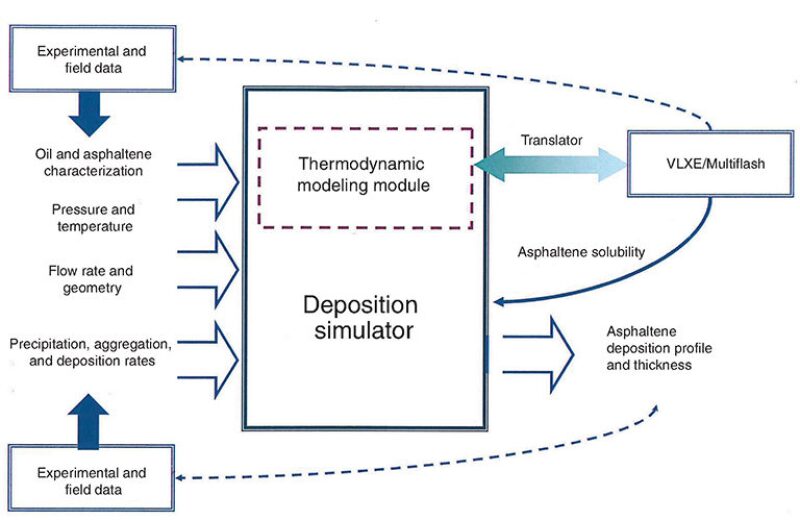
ADEPT comprises thermodynamic and deposition modules (Fig. 2). The thermodynamic module, which works in tandem with software such as Infochem’s Multiflash or the VLXE add-in for Excel, uses the perturbed chain form of the SAFT equation of state (PC-SAFT) to describe the phase behavior of asphaltenes in crude oil. It requires four input parameters to characterize the live oil flow (Kurup et al. 2012):
- Live oil composition
- Density of live oil/stock tank oil
- Bubble pressure at various temperatures
- Asphaltene onset pressures at various temperatures
The thermodynamic module also describes the solubility of asphaltenes along the axial length of a wellbore or pipeline as a function of pressure and temperature. Creek, who helped with the development of the simulator, said this is an important input.
“The precipitant in reservoir fluids is the solution gas, the material with solubility parameters much lower than the asphaltene fraction and in sufficient quality to lower the mixture solubility parameter below the parameter value at onset," Creek said. "The solubility parameters are volume fraction additive, and since the volume per molecule of lighter components such as methane, ethane, and propane change with temperature and pressure, a change in those conditions can change the reservoir fluid solubility parameter to the point of phase separation of the asphaltenes.”
The deposition module describes the transport of precipitated asphaltene particles using a mathematical model that represents a mass balance of aggregates in a controlled volume. The primary components of the model are the transport of the particles by advection and dispersion as well as three kinetic processes, each modeled as first order kinetics: the precipitation that forms the particles, the aggregation of the particles, and their deposition onto the walls of pipelines (Kurup et al. 2012).
The deposition module needs three input parameters before it can be applied in a field case:
- Asphaltene solubility as a function of pressure, temperature, and composition
- Operating variables such as the oil flow rate and the length and diameter of the pipeline
- Constants describing the kinetics of precipitation, aggregation, and deposition
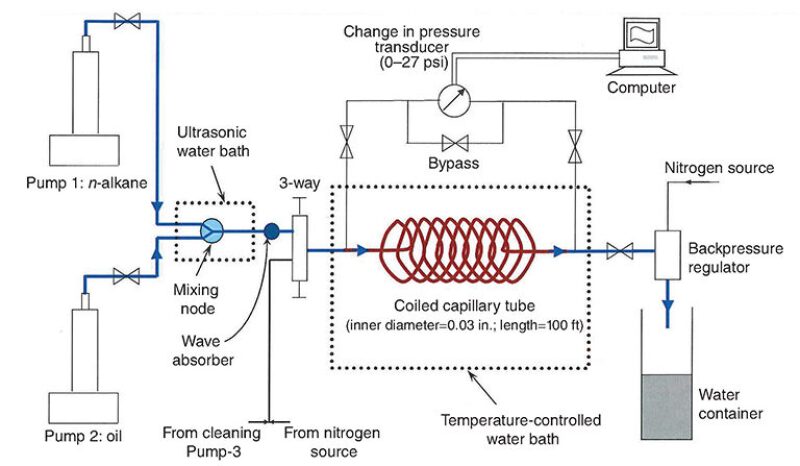
Asphaltene solubility can be calculated through the thermodynamic module. Laboratory experiments determine the kinetic constants by mixing oil with asphaltene precipitating agents at different ratios and measuring the precipitated particles at various times. The kinetic constant of deposition is determined with capillary experiments in an apparatus (Fig. 3) in which oil is pumped through a coiled capillary tube approximately 100 ft long and from 0.02 in. to 0.04 in. in diameter. Oil from one pump is mixed with a precipitant (usually n-alkane) from another pump through a mixing node within an ultrasonic bath. At the end of each experimental run, the deposition profile along the capillary tube is measured.
With the constants determined, the simulator can predict asphaltene deposition and its magnitude within a pipeline or a wellbore. Fig. 4 illustrates a simulator prediction of the thickness of solid asphaltene deposits at various depths in a well in the Marrat reservoir in southern Kuwait.
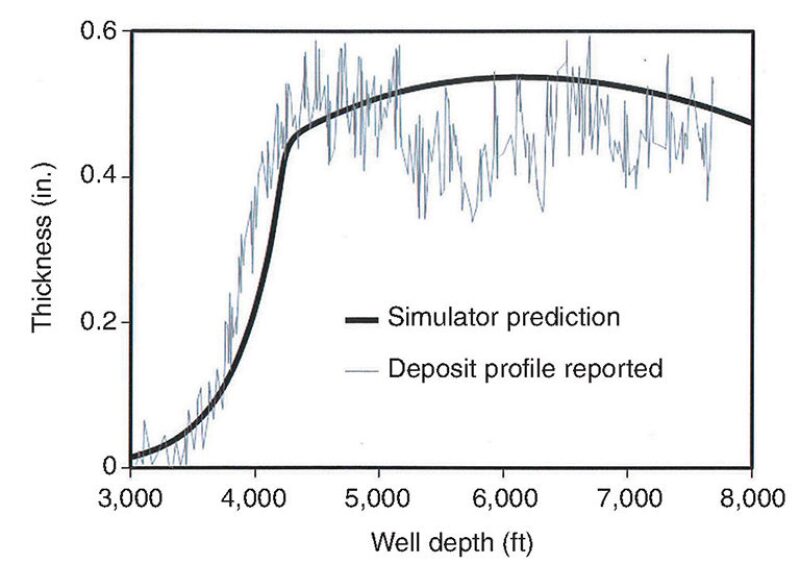
The measurements of the deposit profile were published (Kabir et al 1999), as were as the onset and saturation pressure data for asphaltenes and the SARA (saturated hydrocarbons, aromatic hydrocarbons, resins, and asphaltenes) data. PC-SAFT was used to provide a thermodynamic model of the oil, and Chevron provided live oil composition and saturation pressure data. The simulator predictions, while not an exact match, were very close to the deposit profile reported in the field.
Additional testing of ADEPT is required to verify its performance. Uncertainties remain about the kinetics of precipitation and aggregation when used to predict kinetics in field-scale turbulent flows. Creek said that the best way to determine precipitation and agglomeration rates independently remains unknown.
“Particle agglomeration is in competition with arterial deposition for capturing particles in flow,” Creek said. “If they agglomerate to more than 1 μm, they usually go with the flow, but if they don’t grow fast enough, they are captured in the flow boundary to a degree. If precipitation is not rapid enough, then deposition may not occur.”
Walter Chapman, a professor of chemical and biomolecular engineering at Rice University and one of the primary developers of ADEPT, said that the tools to simulate asphaltene deposition are close to being ready for widespread use within the oil and gas industry. While ADEPT has only been compared to a couple of field cases, companies have already begun working with it.
“We are very close to having the tools to simulate asphaltene deposition,” said Chapman, who also developed PC-SAFT. “We have not marketed ADEPT, but the model is published so that companies can adopt ADEPT to their flow simulators. Similar to other areas such as wax and hydrates, simulation tools continue to be refined as new data is obtained and new physics is understood.”
ASIST Predictive Model
hile ADEPT aims to help operators predict asphaltene deposition in wellbores and pipelines, other models are available that predict the points at which particles precipitate.
One model finding use within the industry is the asphaltene instability trend (ASIST) tool developed at the New Mexico Institute of Mining and Technology. The ASIST tool predicts the stability of asphaltenes in oil.
Asphaltene instability is a sign of oncoming precipitation and deposition. ASIST estimates the condition for instability in a reservoir through a linear extrapolation of the onset solubility parameter vs. the square root of the partial molar volume of a precipitant for a series of n-paraffins (Creek et al. 2009).
ASIST helps predict the asphaltene onset pressures during oil production through titration experiments using stock tank oil with liquid n-paraffins and alkane solubility parameter estimates based on measurements of the refractive index, which come from an automatic refractometer at a constant temperature. Fig. 5 shows the relationship between a solubility parameter of nonpolar molecules (crude oils are mixtures of primarily nonpolar molecules) as a function of the refractive index for a series of paraffinic hydrocarbons.
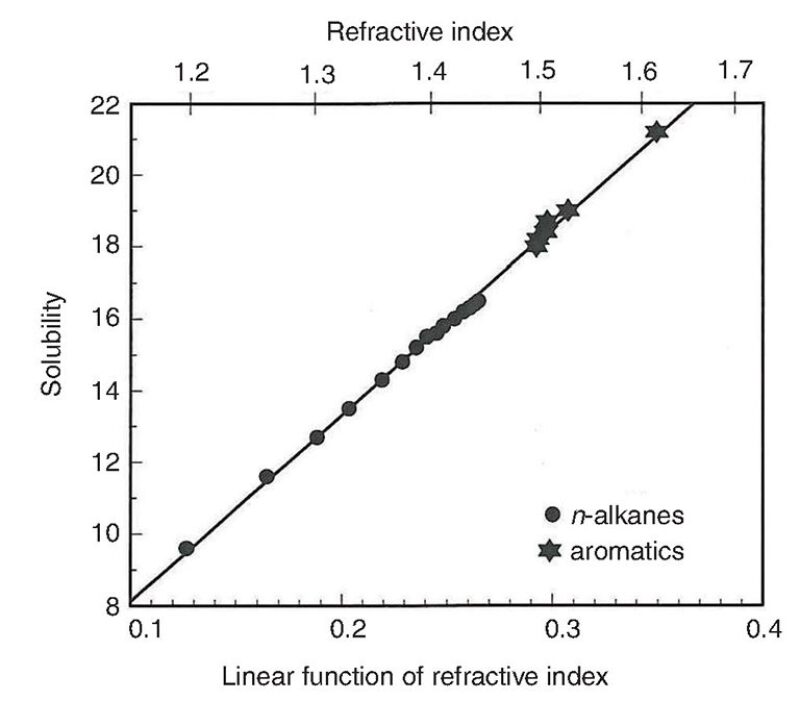
Refractive index measurements eliminate the guesswork regarding solubility parameters as well as the need to observe the onset of asphaltene stability at infinite dilution to quantify solubility conditions (Wang and Buckley 2001).
The conditions for the onset of asphaltene precipitation can be extrapolated from basic data: results from liquid alkane titration experiments of the oil sample; composition data of the oil; and a pressure, volume, and temperature (PVT) description (Mullins et al. 2007).
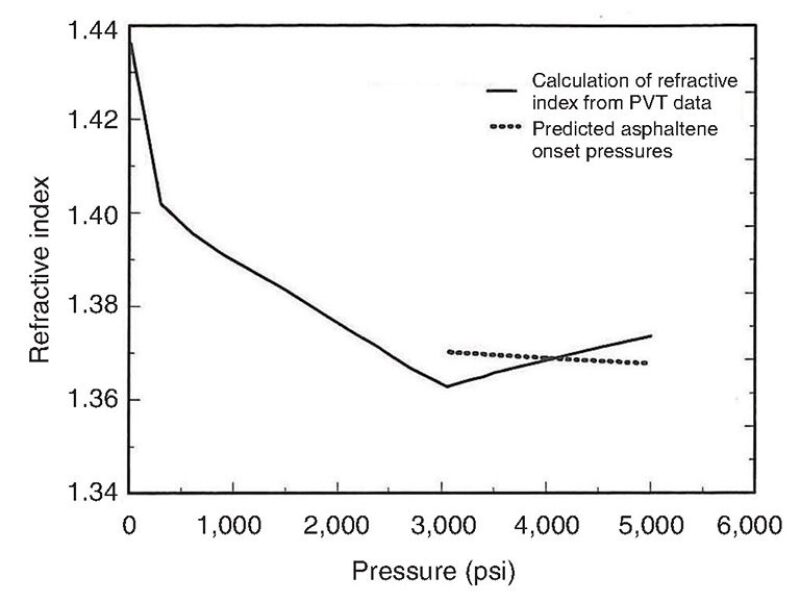
Fig. 6 shows a prediction derived by the ASIST tool using PVT data for a 41.5 °API oil at a reservoir temperature of 184°F (84°C) and a solution gas composed of methane, ethane, and propane. Asphaltene flocculation, the process by which the particles begin to aggregate, is predicted to take place near the oil’s bubblepoint, which is also where the oil’s refractive index falls below the calculated asphaltene onset pressure curve, or the points at which the onset of precipitation was observed at various pressures.
In the Field
The ASIST model has been verified in a number of experiments (Creek et al. 2009) and is a viable tool in developing asphaltene management strategies.
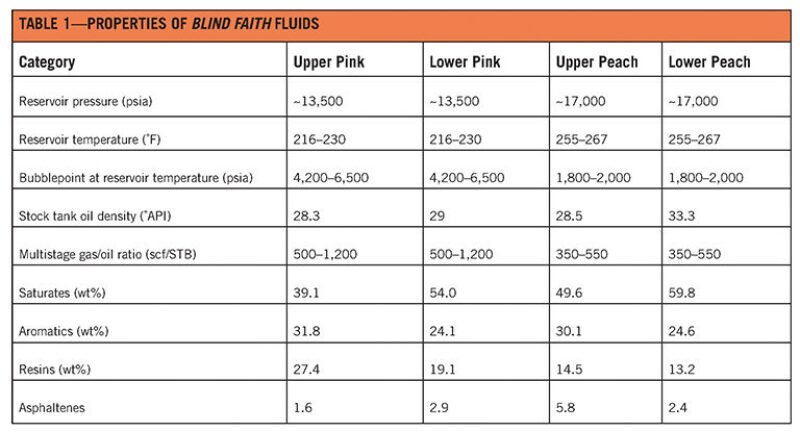
An example of the model’s application is the Blind Faith platform in the US Gulf of Mexico, one of the deepest producing platforms in the world. Located in Mississippi Canyon Blocks 695 and 696, about 160 miles southeast of New Orleans, Louisiana, it reaches a water depth of approximately 7,000 ft and comprises four subsea wells producing from two reservoirs, Pink and Peach. Operated by Chevron, the project drew first oil in November 2008. Table 1 summarizes the oil fluid properties.
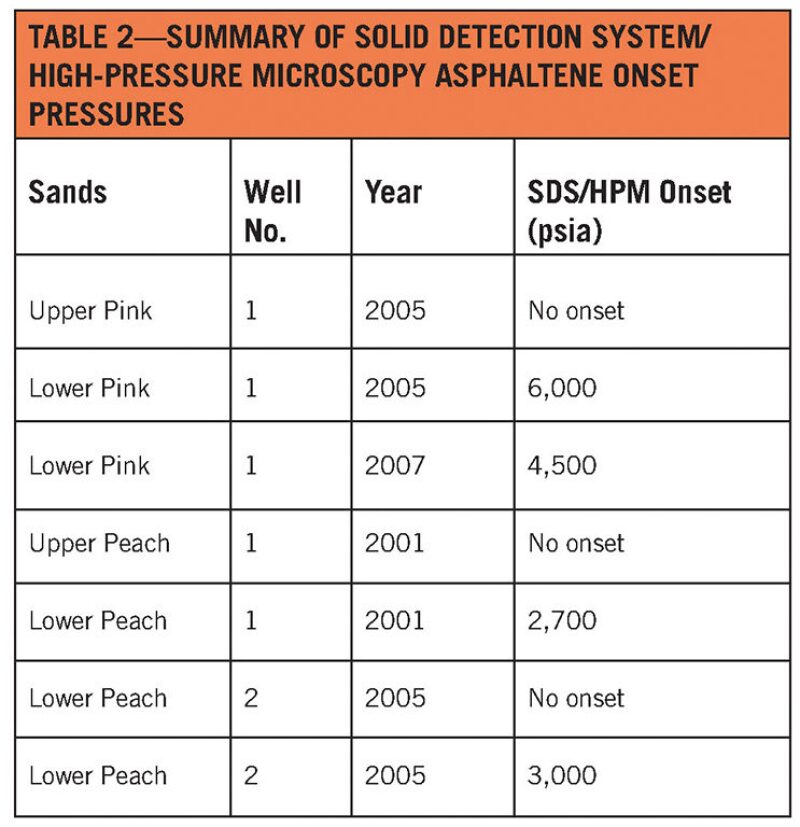
The asphaltene onset pressures were measured directly with high pressure microscopy and solid detection system tests, but this proved difficult, as solids were present at every pressure tested and the samples were opaque (Montesi et al. 2011). Table 2 lists the onset pressures calculated for each sample. The de Boer plots, which chart the in-situ density (the density at a given pressure and temperature) vs. the difference between reservoir pressure and boiling point pressure, showed that asphaltene precipitation could be problematic during the primary depletion process in both reservoirs. However, Montesi et al. noted that this estimate is conservative since it assumes asphaltene saturation at reservoir conditions.
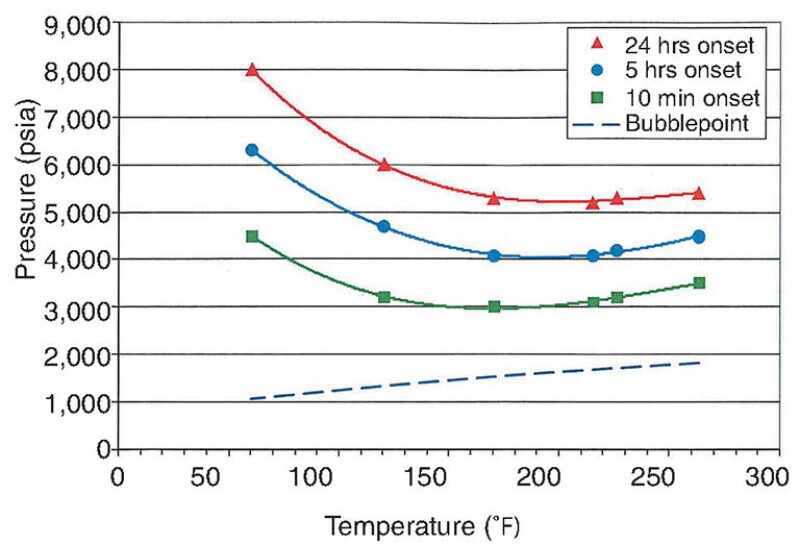
ASIST provided a means to interpret the refractive index tests performed before and after startup. Those tests, combined with deposition tests, helped verify the tendencies of asphaltene particles. The model also made it possible to characterize the kinetics of precipitation, as the refractive index tests were performed for durations ranging from 10 minutes to 24 hours. The results showed that, while fluids from the Pink reservoir did not have a significant risk for asphaltenes, fluids from the Peach reservoir did (Fig. 7).
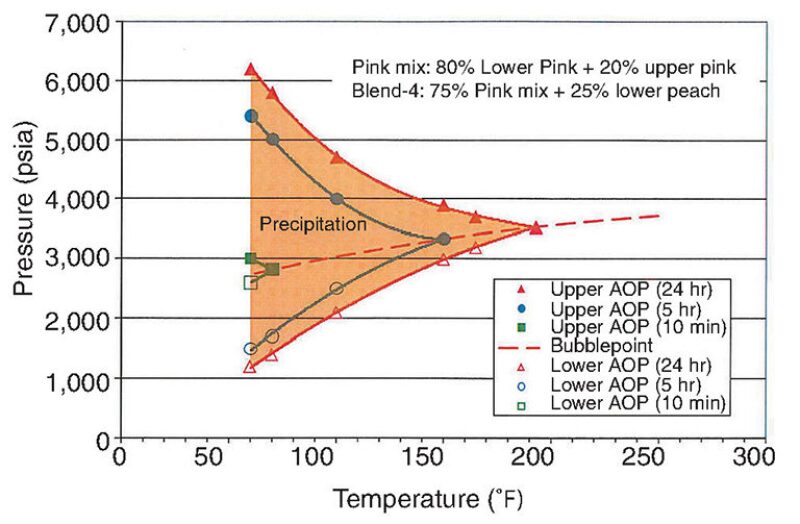
Mixing the Peach and Pink fluids together reduced the region of expected asphaltene instability within the expected range of temperatures and pressures in the wellbore. An example of a mixed sample comprising 75% fluid from the Pink reservoir and 25% fluid from the Lower Peach is shown in Fig. 8. Further testing showed that mixtures with predominantly Pink fluid content were likely to have more stable asphaltene content than mixtures with predominantly Peach fluid content, an important finding given that Peach fluids are mixed with Pink fluids in the flowline tying the wells to the production facility. The prediction was confirmed after 2 years of production.
ASIST also predicted asphaltene instability at flowline conditions during the early stages of production, which was demonstrated to be accurate: Infield flowline pigging 2 months after startup showed returns with asphaltene deposits.
Verification of the ASIST predictions led the operations team to adjust its plan for handling asphaltenes. As the model had indicated an insignificant risk of precipitation in the Pink reservoir, the team opted to stop injecting inhibitors to the Pink wells, leading to 25% savings in the chemical cost per barrel for the field.
With no tool available for modeling, the risk of deposition was determined through laboratory techniques such as Schlumberger’s organic solids and deposition control (OSDC) cell and capillary experiments, along with rules of thumb from the field. The capillary experiment leaves open the possibility that the driving force of precipitation in the test does not approximate the driving force in the field. However, Creek, who worked on the project, said that its single-pass setup allowed for continuous precipitation experiments.
“The goal of the experiment is to determine the deposition mass flux so one can assess the frequency of remediation required or the effectiveness of inhibitors,” Creek said. “Without continual feed and ongoing precipitation, or a time-continuous production of precipitate to feed the deposition, a reliable mass flux cannot be determined. Since the capillary has the advantage of ‘one-pass’ operation and a continuing feed of material, the mass of deposit per unit area per unit time can be more correctly determined and accurately mimic boundary layer accumulation of asphaltene-precipitated solids with time.”
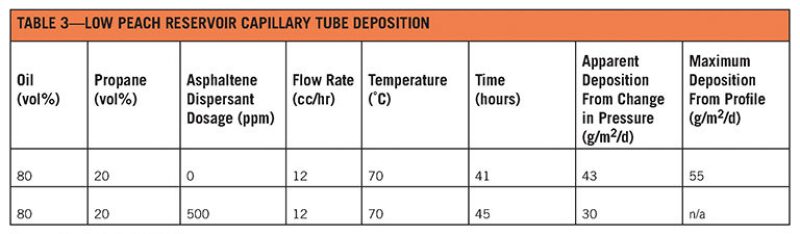
The OSDC test was inconclusive. The oil deposited 3 mg of asphaltene solid out of a 150 cc sample, which indicated an average deposition flux of 3 g/m2/d, but the inherent background noise from the test was greater than the amount of solid deposited (approximately 10 mg). The capillary deposition predicted an average deposition flux ranging from 3 g/m2/d to 5 g/m2/d given the following conditions (Montesi et al. 2011):
Precipitant: propane, n-C7, n-C10, n-C15
- Temperature: from 70°C to 120°C (from 158°F to 248°F)
- Flow rate: 12 cc/h
- Flow time: 45 hours
The capillary deposition was conducted using Lower Peach fluid (Table 3).
For Further Reading
OTC 21587 Asphaltene Management in GOM DW Subsea Development by A. Montesi and R.A. Pinnick, Chevron, S. Subramanian, Chevron Energy Technology Company et al.
OTC 23347 Asphaltene Deposition Tool: Field Case Application Protocol by A.S. Kurup, Rice University, J.S. Buckley, New Mexico Institute of Mining and Technology, J. Wang, Chevron Energy Technology Company et al.
OTC 24168 New Test Method for Field Evaluation of Asphaltene Deposition by R. Alapati, Champion Technologies, and N. Joshi, Anadarko.
SPE 125203 Verification of Asphaltene-Instability-Trend (ASIST) Predictions for Low-Molecular-Weight Alkanes by J.L. Creek and J. Wang, Chevron Energy Technology Company, and J.S. Buckley, New Mexico Institute of Mining and Technology.
SPE 29787 Asphaltenes: The Cholesterol of Petroleum by S.L. Kokal and S.G. Sayegh, Petroleum Recovery Institute.
SPE 53155 Asphaltene Characterization and Mitigation in South Kuwait’s Marrat Reservoir by C.S. Kabir, KOC/Chevron, and A.K.M. Jamaluddin, Hycal Energy Research Laboratories.
SPE 64994 An Experimental Approach to Prediction of Asphaltene Flocculation by J.X. Wang and J.S. Buckley, New Mexico Institute of Mining and Technology.
Akbarzadeh, K., Hammami, A., and Kharrat, A., Zhang et al. 2007. Asphaltenes—Problematic but Rich in Potential. Oilfield Review (Summer): 22–43.
de Boer, R.D., Leerlooyer, K., and van Bergen, A.R.D. 1995. Screening of Crude Oils for Asphalt Precipitation: Theory, Practice, and the Selection of Inhibitors. SPE Prod & Fac 10 (1): 55–61. SPE-24987-PA.
Mullins, O.C., Sheu, E.Y., Hammami, A. et al. 2007. Asphaltenes, Heavy Oils, and Petroleomics. New York City: Springer Science + Business Media.
Yarranton, H. 2000. Asphaltene Deposition. Presented at the Petroleum Society’s Canadian International Petroleum Conference, Calgary, Alberta, Canada, 4–8 June. PETSOC-2000-099-EA. http://dx.doi.org/10.2118/2000-099-EA.