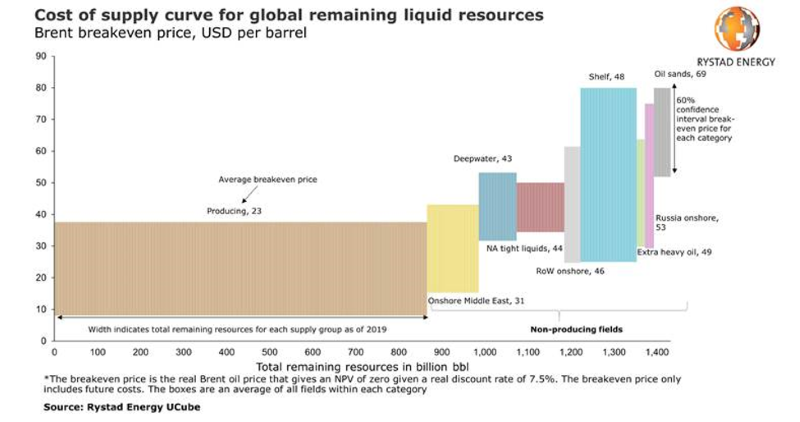
A Rystad Energy analysis of oil-production costs revealed the average breakeven price for all unsanctioned projects has dropped to around $50/bbl, down around 10% over the past 2 years and 35% since 2014. This means that oil is much cheaper to produce now compared to 6 years ago, with the clear cost-savings winner being new offshore deepwater developments.
Our cost-of-supply curve for liquids now reveals that the required oil price for producing 100 million B/D in 2025 has been in continuous decline in recent years, with its updated projection showing that an oil price of only $50/bbl is needed to keep oil production at this level.
Previously, in 2014, we had estimated that the required oil price for producing 100 million B/D in 2025 was close to $90/bbl, an estimate which we then revised in 2018 to around $55/bbl.
The updated curve also shows another key trend. From 2014 to 2018, the cost-of-supply curve moved to the right. In 2014, we estimated that the total 2025 liquids potential was only 105 million B/D. In 2018, this number had increased considerably to around 115 million B/D. However, since 2018, we have revised down the potential to about 108 million B/D, moving the cost curve to the left.
The implication of falling breakeven prices is that the upstream industry over the past 2 years has become more competitive than ever and is able to supply more volumes at a lower price. However, the average breakeven prices for most of the sources remain higher than the current oil price. This is a clear indication that for upstream investments to rebound, oil prices must recover from their current values.

When it comes to breakeven prices and potential liquids supply in 2025 for the main sources of new production, Rystad Energy data show that from 2014 to 2018, tight oil and OPEC came out on top. Back in 2014, the average breakeven price for tight oil was estimated to be $82/bbl and potential supply in 2025 at 12 million B/D.
Since then, the breakeven price has come down and the potential supply has increased for tight oil. In 2018, an average breakeven price of $47/bbl and a potential supply of 22 million B/D was estimated. After 2018, the breakeven price for tight oil has continued to fall, reaching a current average of $44/bbl. However, the potential of tight-oil production has dropped from our 2018 estimate.
Now we estimate that tight oil can potentially supply around 18 million B/D of liquids in 2025. This drop is due to the sharp reduction in tight-oil production during the first half of this year. The lower activity this year, and a potentially slow recovery next year, will remove tight-oil supply from the market.
Between 2014 and 2018, shelf and deepwater projects experienced a cost reduction of around 30%. However, the lack of new sanctioning during the same period reduced the offshore potential liquids supply for 2025. Since 2018, breakeven prices have been falling for offshore, with deepwater down 16% and shallow water down 10%.
This cost reduction puts average breakeven prices for deepwater just below those of tight oil. At the same time, the potential 2025 supply from offshore developments has not changed too much. This makes offshore a winner out of all the supply sources over the last 2 years when it comes to cost improvements and supply potential.
Onshore Middle East is the least-expensive source of new production with an average breakeven price of around $30/bbl. This is also the segment with one of the largest resource potential estimates. Offshore deepwater is the second-cheapest source of new production, with an average breakeven price of $43/bbl, while onshore supply in Russia remains one of the more expensive resources due to the high gross taxes in the country. Shelf remains the segment with the largest resource potential with 131 billion bbl of unsanctioned volumes.
One of the key drivers of the improved costs and breakeven prices for upstream developments are the lower unit prices within the industry. After the 2015 oil-price collapse, oilfield service companies needed to reduce the prices they charged exploration and production companies in order to remain competitive in the challenging market conditions.
For all sources, unit prices dropped close to 25% between 2014 and 2016 but it was tight oil that faced the largest reduction. Since then, the supply segments have recovered differently. While offshore and conventional onshore supply only saw marginal price increases, tight oil unit prices increased considerably during 2018.
However, given that tight-oil activity fell last year and with the COVID-19 inflicted market crisis this year, tight-oil unit prices have started to drop again since 2018. For all the main upstream segments, current unit prices have come down around 30% compared to 2014 levels.
Espen Erlingsen is the head of upstream research at Rystad Energy. He can be contacted at espen.erlingsen@rystadenergy.com.

