There are no reliable estimates of technically recoverable resources (TRRs) for unconventional reservoirs outside North America, and many countries lack the advanced technology such as horizontal drilling and hydraulic fracturing necessary to develop unconventional resources. To encourage investment in these technologies, new resources estimates are needed. The objective of this study was to develop a methodology and software for probabilistic resource estimation and to use this new technology to estimate global technically recoverable gas resources in tight sands.
Introduction
In this paper, tight gas is gas that is present in low-permeability sandstone or limestone formations. In the US, tight gas reservoirs are generally defined as having less than 0.1-md permeability. To produce gas at economic rates from reservoir rocks with such low permeability, massive hydraulic fracturing is necessary.
Petroleum Resources Management System (PRMS). The terms “resources” and “reserves” have been and continue to be used to represent various categories of mineral or hydrocarbon deposits. In March 2007, SPE, the American Association of Petroleum Geologists, the World Petroleum Council, and the Society of Petroleum Evaluation Engineers jointly published the PRMS to provide an international standard for classification of oil and gas reserves and resources. It is important to remember that the broadest categories are also the least precise. As one moves toward the categories at the bottom of the PRMS, the associated estimates of the amount of natural gas in those categories become more and more uncertain. However, technically and economically recoverable resources are not formally classified in the system.
The Energy Information Administration’s (EIA) Classification System. According to the EIA, TRRs are the subset of the total resource base that is recoverable with existing technology. The term “resources” represents the total quantity of hydrocarbons that is estimated, at a particular time, to be contained in (1) known accumulations and (2) accumulations that have yet to be discovered (prospective resources). Economically recoverable resources are those resources for which there are economic incentives for production. It is important to note that economically unrecoverable resources may, at some time in the future, become recoverable as soon as the technology to produce them becomes less expensive or when the characteristics of the market are such that companies can ensure a fair return on their investment by extracting the resources. The authors of the original paper considered TRRs to be the resources that can be produced within a 25-year time period.
The authors rearranged categories of the PRMS, and presented an overview of how the estimates of technically and economically recoverable resources are broken down. Those commercial resources, including cumulative production and reserves, are economically recoverable resources. TRRs are the subset of the total resource base that includes commercial resources, contingent resources, and prospective resources. Estimated ultimate recovery is not a resources category but a term that refers to the quantities of petroleum that are estimated to be potentially recoverable from an accumulation, including those quantities that have already been produced.
Recent Tight Gas Production and Activity in the US. Strong natural-gas demand and technological improvements have turned tight gas into a key element of the US energy supply. The US has been producing tight gas since the 1970s. Between 2000 and 2011, actual tight gas production from the lower 48 states increased from 4.0 to 5.9 Tcf/yr, and it accounted for 23% of the total gas consumption in the lower 48 states in 2011.
Methodology
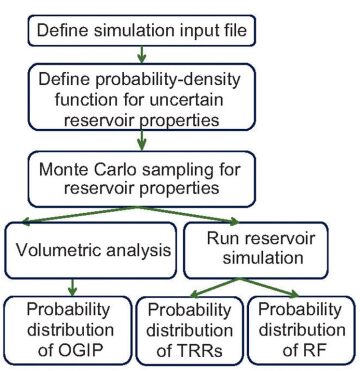
The work flow of the probabilistic reservoir model, the Unconventional Gas-Resource-Assessment System (UGRAS), begins with creation of an input file and assignment of probability distributions for uncertain parameters (Fig. 1). There is no limitation to the number of parameters that can be varied. The distributions are typically normal, uniform, triangular, exponential, or log-normal. These distributions are sampled for volumetric analysis and flow simulation to determine original gas in place (OGIP), TRRs, and recovery factor (RF). Finally, these steps are repeated many times to generate frequency and cumulative density plots for OGIP, TRRs, and RF.
Resource Evaluation of Tight Gas Formations in the US
As of 2011, in regard to US tight gas formations, the Greater Green River and East Texas basins dominated in terms of tight gas production. A detailed simulation study of all the tight gas formations in the listed US basins was not performed. However, performing one or more small-scale simulations on the most productive formation of each basin was considered representative of the basin as a whole—for example, the Lance formation in the Greater Green River basin and the Cotton Valley and Travis Peak tight gas formation in the East Texas basin. These assessments resulted in a solution to the problem of characterizing well and reservoir performance and determining RF.
Reservoir Model. In this study, tight gas reservoirs were modeled as having a conventional single-porosity system. There is only one type of pore space and one scale of pore size. To develop tight gas reservoirs, hydraulically fractured vertical wells are commonly used. The type of outer boundary for the tight gas reservoir is defined as a closed circle. The well is centered in the drainage area.
Reservoir-Parameter-Sensitivity Analysis. The authors investigated the reservoir properties that affect the prediction of OGIP and TRRs. Uncertainty is inherent in the prediction of net pay, permeability, porosity, water saturation, initial pressure, and fracture half-length. However, the assigned well spacing is controllable.
Tight gas OGIP is affected by area, net pay, porosity, pressure, and water saturation. Parameter-sensitivity analysis reveals that net pay, reservoir pressure, water saturation, porosity, permeability, and fracture half-length have the highest correlation to production. These six parameters were treated as uncertain parameters in the paper.
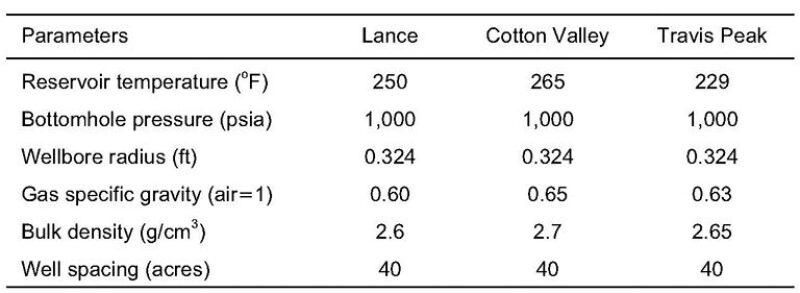
Reservoir Parameters. Table 1 shows the fixed reservoir parameters used for the three tight-gas-reservoir simulations. Table 5 of the complete paper summarizes the range of main reservoir parameters for three tight gas formations in the US.
Model Verification. The authors used the HPDI database as the source for production data. The production histories of all the vertical wells that are more than 7 years old were normalized to zero time, and then the first 7-year cumulative gas production of all these wells for each formation was calculated.
Initially, the authors defined density functions for the six key parameters with uniform distributions by honoring their ranges. Possible correlations among these parameters were not considered. Then, the density functions for the key parameters were calibrated until a reasonable match between simulated and actual 7-year cumulative gas production from the wells was reached. The authors did not make large changes in these distributions to achieve matches. Finalized density functions of the six uncertain parameters for each formation are listed in Table 2. Vertical well spacing has decreased over time.

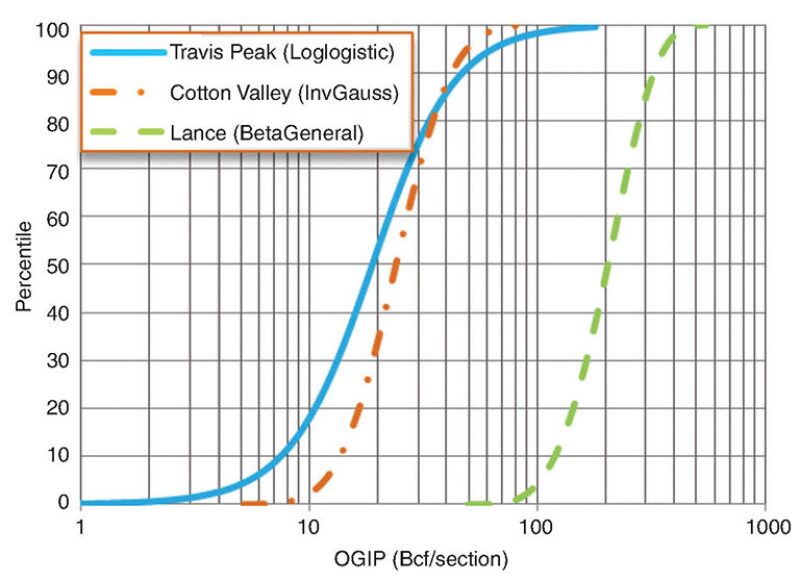
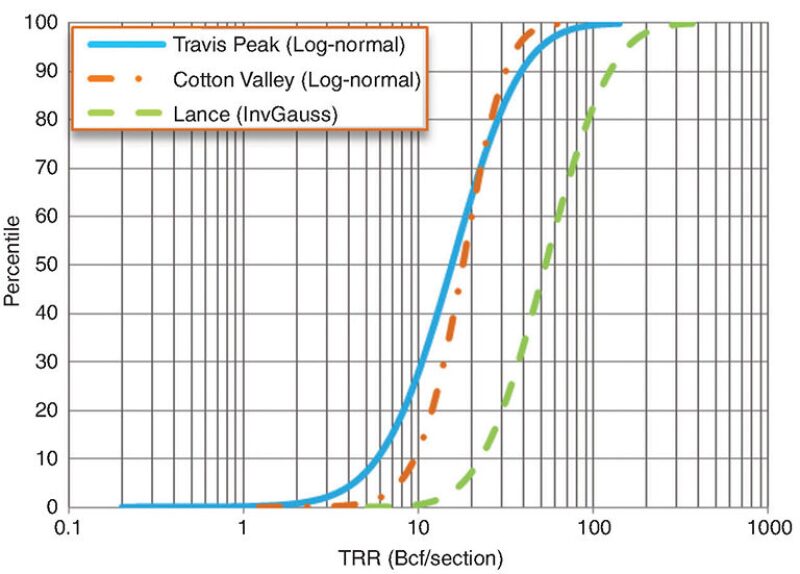
US Tight Gas TRR Evaluation. The cumulative probabilistic distributions of OGIP, TRRs, and RF for the three key tight gas formations were evaluated by use of the fixed reservoir parameters (Table 1), finalized density functions (Table 2), and well spacing as of 2011 Fig. 2 above, Fig. 3, and Fig. 4 show the cumulative distribution of OGIP per section (640 acres), TRRs per section, and RF for the three tight gas formations, respectively. The Lance formation in the Greater Green River basin has the greatest original tight gas in place and TRRs because of its thick net pay, high reservoir pressure, and successful fracture treatments. Relatively high permeability (0.007–0.7 md) in the Travis Peak formation and high pressure (4,600–6,000 psi) in the Cotton Valley make these formations good tight gas producers as well. Compared with the other two tight gas formations, the range of RFs in the Cotton Valley is quite wide (Fig. 4), ranging from 20–90%, mainly because of the large range of permeability (0.0001–0.3 md) and porosity (1–12%).
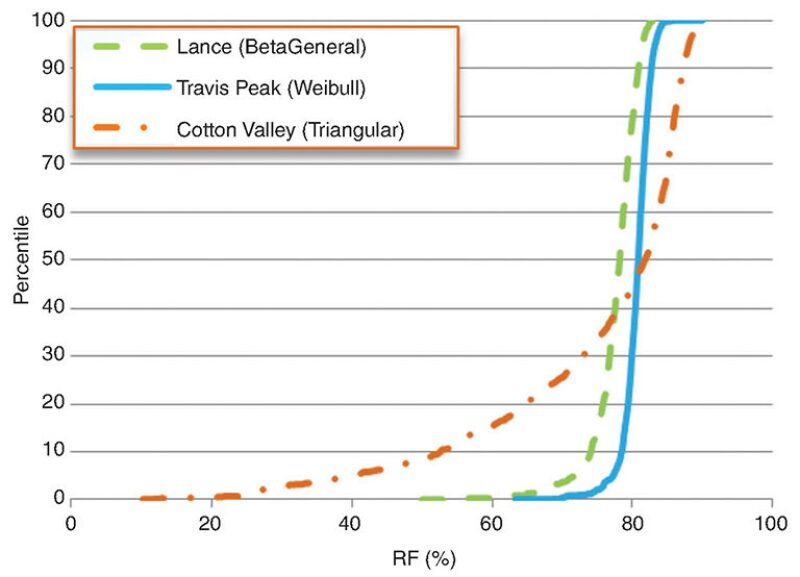
The authors determined probabilistic distributions of technical RFs for the three most productive tight gas formations in the US. There is considerable uncertainty in the RFs, ranging from 20 to 90%. It follows a logistic distribution, with a P50 value of 79%. The RF of the tight gas reservoir is very high, with a range from 70% (P10) to 85% (P90), because the induced hydraulic fractures penetrate most of the reservoir.
Global Tight Gas TRRs
The distributions of tight gas OGIP for seven world regions were determined by first deriving the representative probabilistic distribution of technical RFs from three tight gas formations in the US. The distributions of tight OGIP were multiplied by the distribution of RF to calculate the TRRs from tight gas reservoirs for the seven world regions. Global tight gas TRRs range from 38,000 (P10) to 84,000 (P90) Tcf. Results of this work indicate the existence of significant global resources of technically recoverable tight gas.
Discussions
The technology and tools described in this paper can be useful in assessing probabilistic distribution of OGIP and TRRs in tight gas formations. However, it is important to acknowledge the assumptions and uncertainties inherent in the results presented in this paper. First, we assumed a 25-year well life for calculation of TRRs. Well productive life does not affect TRRs or the RF of tight gas formations when the analysis year is greater than 25 years. As such, the authors chose a 25-year production history to estimate TRRs of tight gas formations.
The resource assessments are high-level assessments. Although resources are estimated for entire formations, reservoir and well properties are not modeled on a well-by-well basis. Instead, each formation is modeled as a whole, using probability distributions that encompass the variability in reservoir properties across the field as well as the uncertainty in these properties. For example, the OGIP varies from county to county because of differences in net thickness and other properties across a field. Another limitation of these high-level assessments is related to vertical variability in properties. The authors did not consider vertical variations in properties, such as fracturability, throughout the zones evaluated. In some areas, the net thickness of the tight gas formations is so great that the entire pay zone cannot be completed and produced. However, the authors used the same distributions of net pay for the OGIP calculation and TRR prediction for the tight gas formations in this study.
The authors also acknowledge the uncertainty in the production forecasts generated by the probabilistic analytical simulator. The input parameters used to generate production forecasts for the three tight gas formations were obtained from the literature and well data. The parameter values and forecasts were reviewed by operators and reserves evaluators in these formations to verify their reasonableness. The probabilistic forecasts for the three tight gas formations were calibrated against actual 7-year cumulative-production data, although this of course does not guarantee the accuracy of 25-year forecasts.
This article, written by JPT Technology Editor Chris Carpenter, contains highlights of paper SPE 165704, “Probabilistic Evaluation of Global Technically Recoverable Tight Gas Resources,” by Zhenzhen Dong, SPE, Schlumberger, and Stephen A. Holditch, SPE, and Walter B. Ayers, SPE, Texas A&M University, prepared for the 2013 SPE Eastern Regional Meeting, Pittsburgh, Pennsylvania, USA, 20–22 August. The paper has not been peer reviewed.

