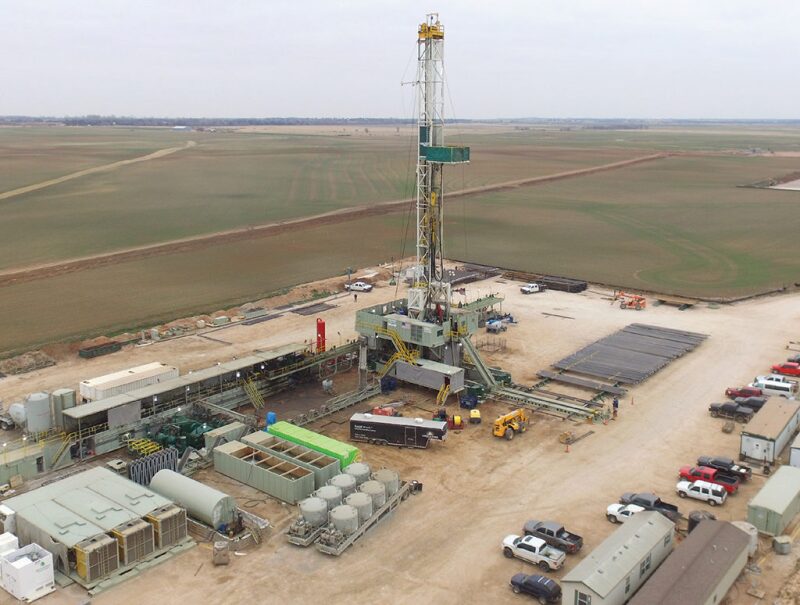
A little over 2 years ago, amid the flat farmlands of central Oklahoma, Devon Energy sent a suite of measurement technologies downhole to study how hydraulic fractures move between wells during the stimulation treatment. The operation in the STACK tight-oil play was what the industry calls a “science project.”
Once the field work was done, and as engineers got to work on the data, they expected to uncover some new learnings. What they did not expect was to find themselves on course to invent a new way to measure the size of fractures, the speed of their growth, and the energy that it took to form them. Knowing these parameters invites the use of the scientific method to control fracture growth for optimal productivity.
The goal of the monitoring project was to marry up data from permanent fiber-optic cables with data acquired by downhole pressure gauges from two wells on the same development unit. Each of the monitor wells was equipped with fiber that ran the length of the lateral. At different points, pressure gauges were ported to the outside of the casing along with gauges that were ported to the inside. All were wired up to the surface.
Engineers at the Oklahoma City-based shale producer had been looking forward to the project because it was one of the first times they would be using fiber optics to measure cross-well strain. A newly established diagnostic in its own right, cross-well strain data have become popular among operators that can afford it because it delivers clear visuals of hydraulic fractures as they come into contact with offset wellbores.
The engineering team wanted to know if the data from the externally-ported gauges, which were touching the rock in order to “feel” pressure buildups, could be tied to the fiber data. Meanwhile, the internal gauges were there to detect any production interference between wells after the completion.
What redefined the project was that the operator—acting on the advice of its fiber-optic vendor—did not perforate the two monitor wells. This was done to prevent reservoir and stimulation fluids from flowing into the casing which might have altered the temperature of the fiber, and subsequently, the quality of the precious strain data.
This recommendation was the difference maker. It effectively turned thousands of feet of steel pipe into a low-cost proxy to high-dollar microseismic surveys and fiber-optic installations. Devon is calling the discovery a “breakthrough” for subsurface engineering.
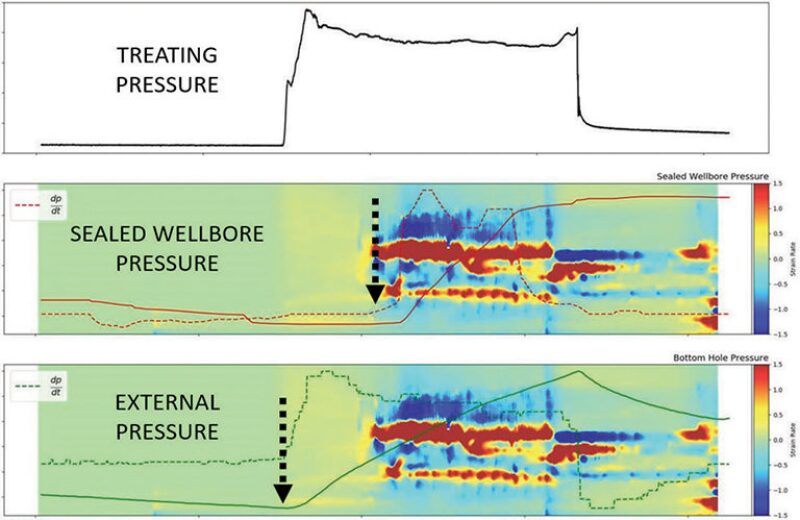
The person to see the first clues of this was Wolfgang Deeg, who at the time was a completions advisor with Devon and is now an independent consultant. Deeg’s role in the project was to analyze the fiber data, but he also decided to take a look at the data collected from those internal pressure gauges. He was puzzled. Within the data set were small, but clearly identifiable pressure changes.
“The first thing I asked myself was, ‘Does that even make sense?,’” recalled Deeg. “I ended up calculating what the required increases in pressure had to be on the outside of the casing, and they were consistent with the numbers we were seeing. That was encouraging.”
However, the mystery was not yet solved. For others on the team, the unforeseen pressure data remained “more of an interesting discussion than it was meaningful—we didn’t know what it meant,” said Kyle Haustveit, a senior completions engineer at Devon.
But then Haustveit started to compare the cross-well strain and pressure data from corresponding fracture stages, lining them up according to their time stamps. “I did about five or six of them and saw an unbelievable relationship,” he said, pointing out that this was “what triggered our ah-ha moment.”
An engineering technician took over the process for about 200 more fracture stages and compiled all the visuals into a single slide deck. “We then sat down as a group, put it on presentation mode, and clicked through every stage,” said Haustveit. “You just saw it over and over—the strain front arrived right at the pressure inflection.”
The product of this revelation has since been given a name: sealed-wellbore pressure monitoring (SWPM).
Devon is using it to figure out how much water and proppant it can squeeze between wells before the newly created fractures actually touch an offset well. This is a loose definition of what the shale sector calls “right sizing.”
To simplify the SWPM concept, Haustveit likened it to squeezing one end of a long balloon. As the balloon’s shape deforms, the entire column of air inside is compressed toward the other end.
Taking the analogy back to a sealed wellbore, which in this case is filled with water, he said, “We start pumping the treatment well, the fracture extends, we apply force to the monitor well—slightly deforming the casing—and we see that pressure inflection very well.” Haustveit shared these details while presenting a technical paper (SPE 199731) that he coauthored with more than a dozen other Devon engineers at the recent Hydraulic Fracturing Technology Conference (HFTC) in The Woodlands, Texas.
One major takeaway he highlighted at the conference is that the newly emerged diagnostic generates “very consistent, clean pressure responses” that can be seen in real time and are not biased by where the fracture interaction happened. The latter advantage is a distinction from offset-well pressure monitoring techniques that rely on producing or already perforated wellbores.
The connectivity of existing fracture networks and the fluidity of the rock fabric mean that the more-common applications of pressure monitoring acquire a noisier data set that often exceeds hundreds or thousands of psi at different stages of the treatment—potentially masking the true moment of a fracture tip physically passing over a monitor. “It can be great. It can be challenging. It can be almost impossible at times,” Haustveit said of non-sealed wellbore pressure monitoring.
In similar fashion, the external gauges used in the initial pilot proved too sensitive as well, recording almost instantaneous pressure inflections at early points in the job. This happened even when a growing fracture was not aligned with the monitor gauge. Pre-existing fracture networks that transfer new fracturing energy quickly are thought to play a big role here.
By contrast, the pressure changes seen from the internal gauges were minute, registering only between 0.5 psi and 1.0 psi in magnitude. Small, yet unambiguous. These simple, almost binary outputs are all an engineer needs to confirm that a fracture has intersected the monitor well.
And based on an operator’s history in a field, and what it knows from using other diagnostics such as microseismic, one can generally assume that fractures in the same area follow the same azimuth. This gives the operator some spatial awareness of where the responses are really originating from.
The concept is also poised to flip the negative connotations associated with fractures that impact other wells, known to the industry generally as frac hits, or increasingly, fracture-driven interactions. Instead, it shows that fracture interference can be converted into a valuable and flexible toolbox. The trove of answers to be found within the new data includes metrics—e.g., fracture half-lengths, heights, and fracture cluster efficiency (i.e., fluid distribution)—that have until now, been either too difficult or costly for shale producers to obtain on an every-well basis.
Patent Pending, Industry Adoption Pending
Devon has largely moved beyond the validation stage. SWPM is used on most of its infill well operations. While the pilot used downhole gauges, by ensuring the casing is filled with water up to wellhead, the operator has moved to using even cheaper surface gauges to record the responses.
And though SWPM is new to most of the industry, Devon has been sharing details at industry workshops and with peers for several months. To increase its confidence, the operator partnered last year with four other shale producers that could validate the methodology against other diagnostics.
Together, the five producers have successful used the method to monitor over 2,000 fracture stages in eight different shale plays: Midland Basin, Delaware Basin, Eagle Ford Shale, STACK, Powder River Basin, Marcellus Shale, and the Utica Shale.
The method is patent-pending, a factor that is likely to stunt the adoption rate of SWPM, at least in the near term. Devon has signaled intentions to license its use to other operators and is currently authorizing others to test the concept on an ad hoc basis, but no formal plan for its widespread use has been established.
The debut of the method coincides with a wave of commercialized services developed for offset pressure monitoring. A few short years ago, this was the remit of only small instrument companies. But over the past several months the industry’s largest service companies—Baker Hughes, Halliburton, and Schlumberger—have all released similar real-time offerings that monitor inter-well pressures during a hydraulic fracturing treatment.
One reason Devon may want to commercialize its innovation is because it would enable the creation of a statistical database that operators would build together. With enough observations, and based on certain spacings, probabilities of when to expect fracture interactions could be assigned for different plays. If a stage is off trend, engineers could use the historical library of data for guidance on what to do next.

Getting Closer to Real Time
Speaking from the podium at HFTC, Haustveit emphasized to hundreds of fellow petrotechnical professionals that the advent of SWPM and its various outputs should inevitably lead to the implementation of real-time completions where reservoir responses are used to guide fracture design.
“Our completion designs are predominantly geometric, same cluster count, perf count, fluid and sand design per stage—but we know the rock properties are changing,” Haustveit said. “And right now, monitoring fracture growth in real time is difficult. It can be costly, and ultimately, most methods are not scalable because of the cost implications.”
But SWPM is a low-cost and scalable option. It is nondisruptive to multiwell completions, and at a minimum, it requires an operator to have just one passive wellbore, a surface pressure gauge, and a spreadsheet. Devon has used at most three wells at a time in its SWPM trials, noting that more monitors deliver more spatial awareness.
Devon has made other strides to iterate and refine the process. It is combining the real-time monitor data with fracture models and rate-transient analysis techniques.
It has automated part of the work flow by using software from analytics firm Seeq which enables the engineering team to insert their own algorithms to smooth the data and identify only the most critical peaks. This step is not required but does increase the scalability of the method.
Deeg also stressed that SWPM needs to be coupled with contextual data. “You have to be fully aware of everything that goes on in the field,” he said. “You cannot look purely at the data and draw direct conclusions, you need to know the order in which you are pumping stages, especially if you’re doing zipper operations.”
One obvious drawback is that an unperforated well is needed to be an effective monitor. As more pad wells are completed, the last one will eventually need to follow suit. To mitigate this issue, Devon is currently testing variations of the SWPM to work in a back-and-forth fashion on a two-well zipper completion using plugs.

From Signal to Insight
The first-principles approach that SWPM represents is novel in part because it enables mass balance concepts to be applied to act on the pressure signals. Devon’s paper revolves around several case histories that underline this. The metric that best illustrates SWPM’s versatility, and is used in almost every application, is a new measurement that the company calls “volume to first response” (VFR).
“It is what it’s called,” said Haustveit, explaining that VFR is simply the volume of fluid pumped into a treatment well at the time that the first fracture was detected at the monitor well.
By quantifying the placement of water and sand in real time, completions engineers can experiment with the stimulation to find a goldilocks zone. In some cases, the data will tell an operator to lower its pumping volumes to avoid overcapitalization on a problematic stage by sending too much sand and water too far into the reservoir.
It works the other way too. Maybe an operator sees the reservoir can drink more of the slurry and will then decide to up the investment in a particular stage. “Imagine, you can get more even drainage, more stimulated reservoir volume, and a more productive well,” by letting VFR guide the design of a fracture stage, Haustveit said.

With its partners and through its own validation studies that used corresponding diagnostics, Devon has made some key conclusions about using SWPM and VFR. Many of them can be arrived at in real time. And each unlocks key fracture geometry parameters, that in turn, fill in gaps that can make hydraulic fracture models more accurate.
- Fracture half-length: If an operator knows the distance between wells, then VFR narrows the estimate of how long fractures are because it is proof positive that a physical connection was made between two points.
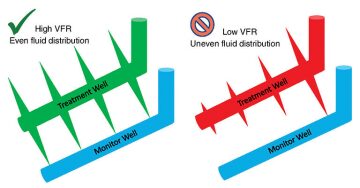
- High vs. low VFR: When well designs and spacing are constant, a higher VFR indicates improved fluid distribution and a more balanced fracture network. Low VFRs correlate to uneven stimulations, and may mean that one or more perforations became overly dominant.
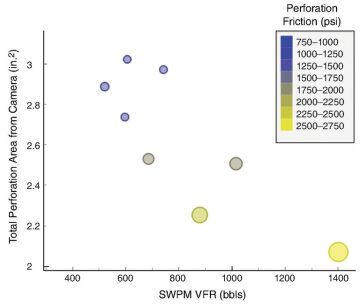
- Cluster efficiency: VFR can be used to rank clusters, with higher VFR figures representing better clusters. Devon validated the correlation using downhole cameras to analyze the size of perforations and the friction required to erode them. Devon believes cluster efficiency is among the most important parameters that can be controlled in real time thanks to SWPM.
- Fracture arrivals: In the early pilots, Devon used SWPM to discern when far-field fractures were arriving and closing back up around the monitor. There can be multiple “arrivals” during each stage. Tracking them enhances the picture of cluster efficiency. This aspect is qualitative though. If there are 10 perforation clusters in a stage, and only five fracture arrivals, that may still indicate satisfactory efficiency. Only three arrivals would not be a good outcome though and may mean that a supercluster formed, leading to what completions engineers call “runaway fractures” that are overly long and cause fracture asymmetry.
- Cluster design: In the Permian Basin, Devon tested two completion designs: 250-ft stages with 10 clusters each (the legacy design) and 15 clusters (a new design). After normalizing the data, the operator calculated that the 15-cluster design resulted in 20% more fluids being placed between the treatment and monitor well before a VFR occurred. A fiber production log run after completion confirmed that the stages with the highest VFR were contributing nearly double the production of the stages with the lowest VFR.
- Fracture height and barriers: In so-called “stacked” developments, where wells are staggered apart vertically, SWPM can be used to estimate fracture height, much in the same way it applies to half-lengths. However, this application requires pinpoint fracturing (or just a single cluster perforation). Devon also uses VFR to determine that a potential fracture barrier, a high-calcite interval, was in fact breached during a stimulation. Devon found that wells landed in the same plane had a 95% chance of seeing fracture interactions at a distance of 700 ft, while wells 1,600 ft apart had only a 50% chance. In wells spaced laterally and staggered at different depths, fewer fracture interactions were recorded. Engineers believe while not a true barrier, the high-calcite interval was a “minor baffle” that reduced the interactions.
- Depletion identification and mitigation: Shale producers, including Devon, are increasingly using parent-child mitigation strategies known as recharging and preloading. Both involve replacing some portion of produced fluids with water to form a pressure shield where there would otherwise be a pressure sink. In these scenarios, VFR can be used to tell if a preloaded reservoir has sufficiently altered stress and pressure to the point of mitigating fracture asymmetry that is often the result of depleted zones. Additionally, Devon is theorizing that low VFRs in depleted zones are an indication of fracture “short circuiting,” which occurs when new fractures intersect rapidly with existing parent-well fractures. A high VFR here would suggest new fractures are growing, and moving more slowly, through unstimulated rock.


