Obtain a sample of reservoir rock, heat it up, add pressure, and then take a real close look at the drop of oil that comes out to find its unique “fingerprint.”
At a high level, this is the emerging extraction and geochemistry process that more than two dozen tight-oil producers have recently adopted to solve one of the shale sector’s biggest mysteries: how does oil flow through the rock matrix and into a hydraulically fractured horizontal well?
In a stacked formation, that question branches off into a few more: how much do neighboring horizontal wells communicate, which zones are co-producing the most, and how do these factors change over time?
“The ground truth comes when you collect rock, and know exactly what depth that rock comes from, and then extract hydrocarbons from that rock to know the fingerprint of that depth,” said Faye Liu, the founder and chief executive of geochemistry startup RevoChem.
Founded last year, the Houston-based firm has so far identified a geochemical fingerprint in more than 5,000 reservoir rocks and produced oil samples from more than 300 wells in nine different shale plays in North America and the Vaca Muerta Shale in Argentina.
Every new sample sheds a bit more light on the complex flow patterns of unconventional reservoirs. Among RevoChem's findings is that pad wells placed in different benches of a tight reservoir stand a high chance of experiencing some level of cross-well communication (Fig. 1).
“All of your oil is a mixture coming from multiple zones,” explained Liu who was formerly a geochemist with ConocoPhillips. She noted that despite how they appear in modeling software, the evidence from geochemical fingerprinting shows that hydraulic fractures often extend out of their target zone and into other oil-rich layers of rock. “Essentially, every operator is experiencing the same process.”
A primary goal for adopters of the technology is to describe that vertical drainage in detail—and how the profile changes over time. “In a stacked development, every sub-surface professional must be engaged with that understanding,” said Toby Deen, a senior engineer with private Permian oil and gas company Felix Energy, which started conducting time-lapse fingerprinting earlier this year.
In addition to vertical production allocation, operators are using geochemical fingerprinting to overcome the difficulty that other diagnostics have had in assessing the related parameter of fracture height. If wells are believed to have a fracture height somewhere in the range of 400-600 ft, then using wider distances between vertically separated wells to avoid interference is justified.
However, if the geochemistry shows that only 5-10% of the cross-well production is from the extreme tips of such a fracture network, then wider spacing may not be optimal (Fig. 2). What would make future spacing decisions easier is if an operator could prove that a majority of production is coming from an area just 200-300 ft away from the wellbore. “That means there is a lot of infill potential,” said Liu.
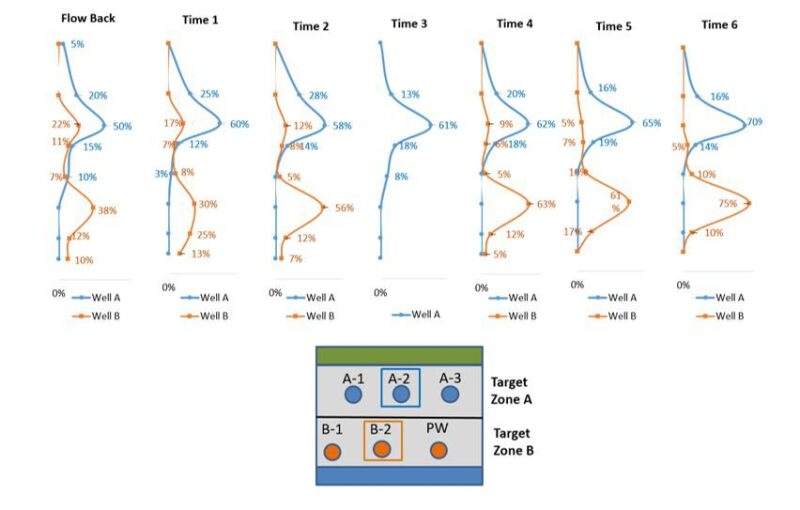
Fig. 1—This chart shows the production allocation results as determined by geochemical fingerprinting. Production sharing between these two horizontal wells occurred over a time period of 7–8 months. This time-lapse production allocation represents a new form of analysis for the unconventional sector. Source: RevoChem.
Use by Operators
Marathon Oil described at a conference last year how it is using the technology to study how much of its produced fluids originate from outside the reservoir area nearest a well’s landing zone. The Permian producer is applying its learnings to well inventory and spacing. Other regular users of the technology include Occidental Petroleum and its newest acquisition, Anadarko Petroleum.
On the smaller end of the spectrum is Felix Energy, which operates in the Delaware Basin. Felix is taking oil samples from wells once a week to see if production allocation shifts, i.e., how fracture conductivity changes. But it is early days for these monitoring efforts, which means Felix has made no changes to its spacing program or well designs based solely on the geochemical fingerprints. However, the operator has found fingerprinting to be useful in confirming the presence and effectiveness of geomechanical barriers, or “frac barriers,” which do represent a major input for well spacing and fracture designs.
“We’re trying to connect the dots,” said Deen, who pointed out that as the company becomes familiar with its new data set, it is “not too wrapped up in the quantification” of the cross-well communication. “How much communication is too much? Well, in our mental model it depends on what point in time you’re talking about—and there’s not an easy or simple answer to that.”
Felix continues to use the shale sector’s traditional route of rate-transient analysis (RTA) to piece together its interpretation of reservoir dynamics. But Deen acknowledged that the complexities of infill drilling in tight reservoirs has made the answers derived from this time-tested but conventionally developed workflow somewhat “murky.”
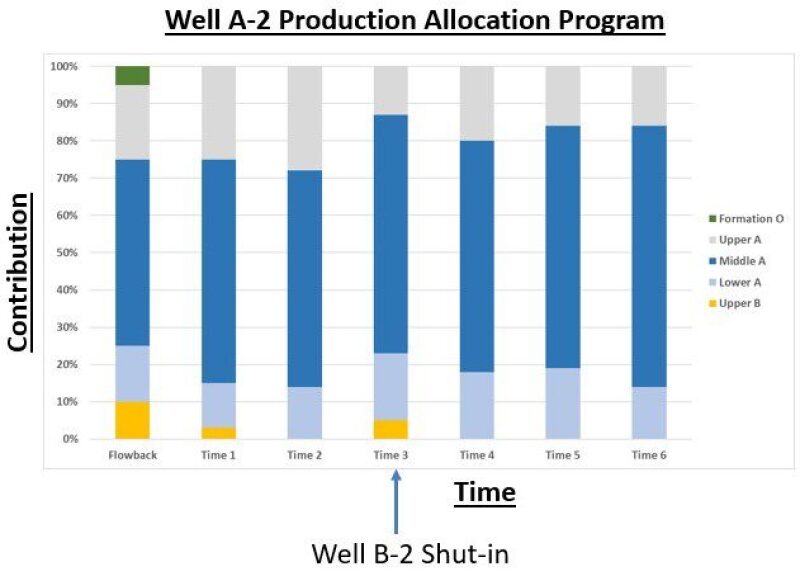
Fig. 2—This chart reflects the total shared volumes between the two wells outlined in Fig 1. The figures shown here indicate that despite the early flowback period and the shut in of an offset well (which creates a pressure build) there is no substantial long-term production-sharing between the two wells. Source: RevoChem.
Hunting for the Endmember
RevoChem said that it is able to paint a clearer picture of production behavior than RTA because instead of using proxies (e.g., flowing pressure data) it uses direct measurements of the produced fluids. This starts by taking cutting samples as a well’s vertical section is drilled, an established practice also used used in DNA diagnostics. To get the highest reasonable resolution, these samples are taken every 10-15 ft as the bit moves deeper. This stratigraphic sampling becomes the foundation for estimating fluid drainage height.
The second key piece to the process involves the physical extraction of the oil from the cuttings. Because of its nanodarcy fabric, oil does not flow naturally from shale rock, which is why hydraulic fracturing is needed.
In the laboratory, pyrolysis does the trick. Liu said the firm's method uses reservoir temperatures and pressures to “mimic how hydrocarbons are produced” so that only mobile hydrocarbons form each sample. “You extract much less, but it’s much more relevant,” she added.
An analysis is run to hunt for unique classifiers called endmembers, which are defined as the “extreme end” of a chemical chain. This is the essential element of this brand of oil fingerprinting. Providing the endmembers are the various aromatics and alkanes found within the oil, gas, and water that flow to surface.
One enabling technology behind this approach is called comprehensive two-dimensional gas chromatography (GCxGC). A test platform atop GCxGC has the ability to analyze between 2,000-3,000 different compounds found in hydrocarbon samples, compared with about 100 compounds that can be traced using traditional geochemistry methods. This higher resolution is leading RevoChem to draw similar conclusions on flow regimes in tight rocks as those shared in mounting industry studies that outline how wells landed vertically just a few feet apart often have different production outcomes.
Fracture Healing and Rock Quality
Data provided by RevoChem show that the producing area of fractures is highly dynamic and that there is a tendency for such communication to dissipate with time. The data also suggest that stacked wells often share the most fluids from each other’s producing zone in the first few weeks after being stimulated via hydraulic fracturing.
In a case study of two vertically stacked wells, one of the wells was capturing up to 10% of its oil stream from the zone during the early flowback period, suggesting that the fractures healed at some point. Subsequent sampling and a shut-in of one of the wells confirmed that the two wells eventually stopped communicating. Other tests support the concept that the highest-quality rock, or the point where it is best to initiate hydraulic fracturing, should not always be defined by the total organic content (TOC).
“It’s the source of the hydrocarbons, so TOC can be a good thing—but what matters most is the reservoir quality,” Liu said. Testing in a Wolfcamp Shale project showed that landing in a zone with lower TOC just 10-15 ft away from the zone with the highest TOC resulted in a more productive well.
The geochemistry data also show that high TOC correlates to high kerogen, which in a conventional formation is much more of an ideal target. But in shale, mistaking high TOC content for a potential high-producing well has led to disappointing results since it comes with heavier molecules that do not flow easily through nanopores.
In horizons considered more of a tight rock than a true shale, such as the Permian’s highly targeted Bone Spring formation, Liu said the TOC rule of thumb still holds supreme over reservoir quality. “That’s where having the maximum amount of hydrocarbons becomes more important,” she said.