Completion engineers have figured out some rules of thumb about how proppant flows based on decades of experience.
That knowledge was put to the test when GEODynamics created a fracturing surface test that offered a full-size, full‑pressure recreation of a stage design created by its initial backer, PDC Energy.
Before the oilfield service company’s first test was pumped. those involved put their money into a pool with the winner based on who most accurately predicted how much sand flowed out of each cluster.
“The one that won the bet was the CFO who had no idea how fracs were supposed to work. The worst were the ones that thought they knew fracturing,” said Phil Snider, a consultant on the project who played a key role in the design of the test.
Like the pool, the test results diverged from the widespread assumption that the fluid and the sand flow out in roughly equal proportions at each cluster.
The results suggested “proppant and fluid does not move as uniformly as many believe,” said Steve Baumgartner, senior engineering technical advisor at GEODynamics, while describing the testing at the recent SPE Hydraulic Fracturing Technology Conference and Exhibition (HFTC).
Some of the results were consistent with earlier studies using computer modeling and less-realistic flow tests showing that many fast-flowing sand grains slip past the first few clusters in a stage.
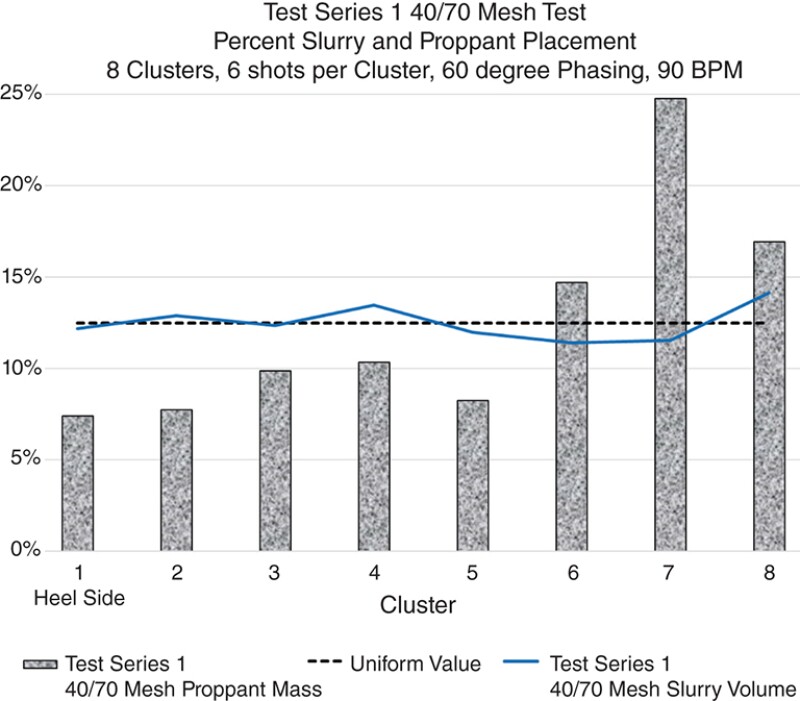
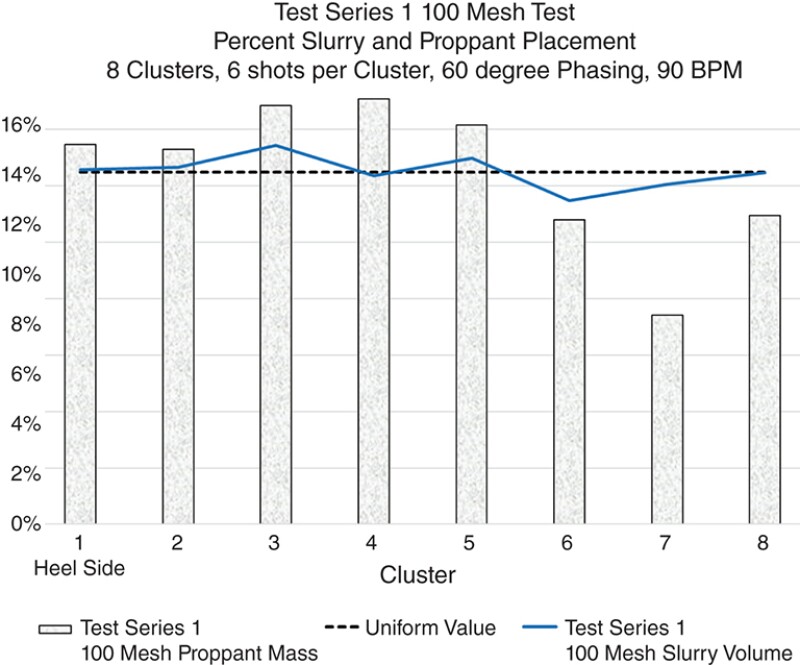
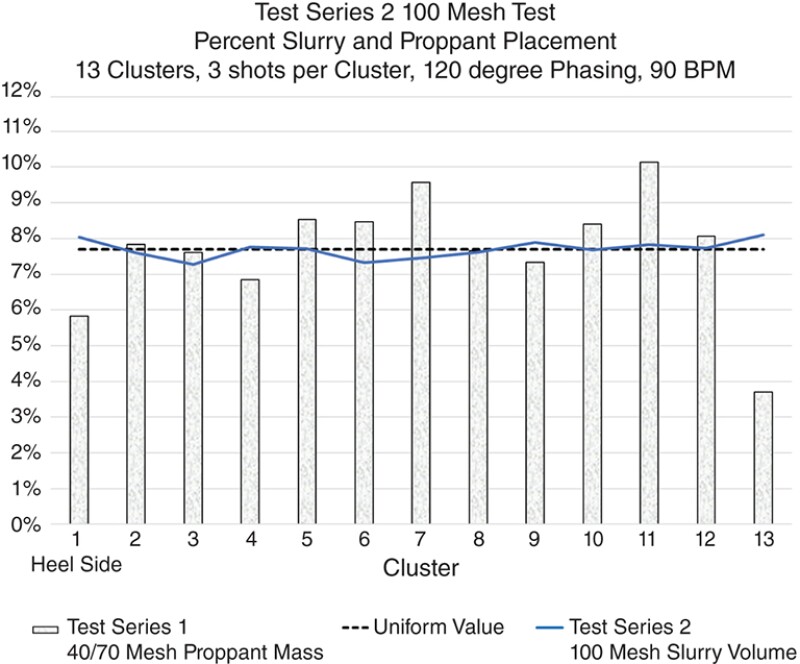
GEODynamics found that medium-sized proppant (40–70 mesh) is likely to slip past early stages, resulting in reduced outflow in early clusters and more flowing out later in the stage. But if the grains are smaller (100 mesh), the distribution is more even.
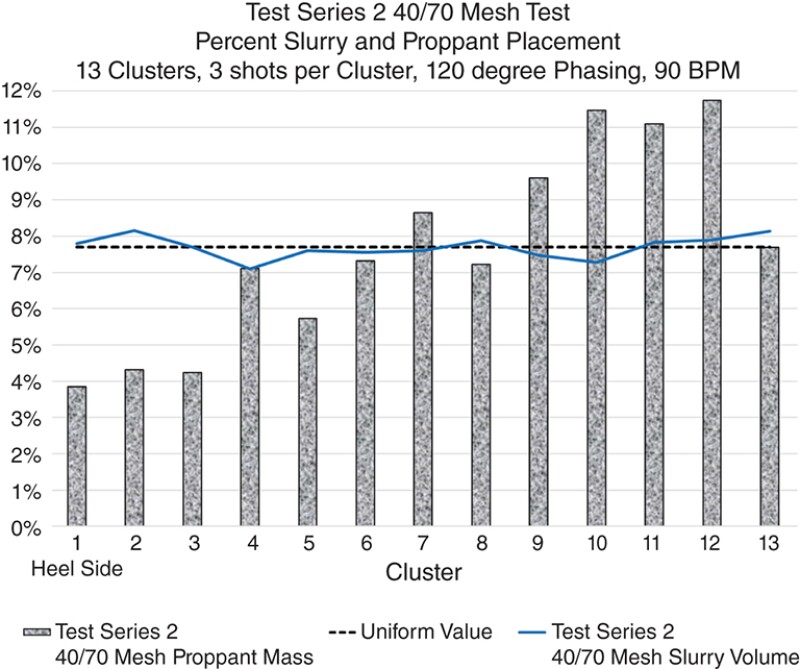
A second round of tests showed that a change in the fracture design aimed at achieving more even slurry distribution from cluster to cluster further reduced the differences among clusters, but bigger grains still tended to slip past early clusters.
What GEODynamics made public is a first look at an ingenious bit of engineering used for a series of tests that ended in 2019, before COVID-19 hit (SPE 209141).
The idea for the test goes back to questions raised by past fracturing jobs. For example, when a well where data gathered during fracturing indicated all clusters were effectively stimulated, but later analysis indicated about half of them failed to produce. Why?
“This nonuniformity can be attributed in part to formation variability and stress shadowing from adjacent fracture stages, but nonuniform flow of proppant in the casing can also play an important role,” said a second paper on creating a model for completion engineering.
The notion that sand grains and fluid do not move in lockstep does not seem surprising because sand grains are likely to behave differently from a mix of water and friction reducer.
The hard question for any engineer who wants to begin designing completions based on the assumption that fluid and sand flows are not similar is how to quantify that difference.
GEODynamics is offering an alternative in the papers which is based on the modeling done using its test data as well as downhole fracturing analysis. That work has since been incorporated into a fracturing advisory program, called StageCoach.
The analysis was among the in-kind support done by a group of supporters that grew to include Apache (now a subsidiary of APACorp), Chesapeake Energy, ExxonMobil, Hess, and Jagged Peak Energy.
Now that they are showing results from the first two rounds of testing, it is open season for those who question whether the most realistic surface test ever is realistic enough.
No one questions that they did something difficult by coming the closest ever to matching how multistage fracturing is done in horizontal wells.
“They did a great job of setting this up,” said Dave Cramer, senior engineering fellow for ConocoPhillips. He said this paper is an excellent resource for “anyone contemplating a test like that.”
But anyone creating a fracturing simulation can expect to be bedeviled by those who point out it does not fully reflect downhole reality, including Cramer.
In this case they pumped far less sand than in an actual frac because the full volume would have been unmanageably large and costly. And while the test did include the addition of friction reducer to the fluid—2 gallons per 1,000 gallons of water for round 1; 1 gallon per 1,000 gallons in round 2—they did not use the higher concentration needed to create high-viscosity friction reducer.
It would have been an interesting addition because the thicker fluid may well have evened out the distribution of sand flowing out of the clusters of the test stage.
For Cramer, that was a big omission. But Baumgartner said their backers approved the lower concentrations because at the time they were not using higher concentrations of those polymer-based additives for cost reasons. And there was a limit to how many tests they could run. Baumgartner said they had to say “no” to testing a long list of variables that “would have resulted in a huge matrix of experiments.”
Why Not?
After Baumgartner’s presentation, a person in the audience got up, offered his compliments, and said, “It is hard to believe it is the first test, but it is the first I have seen.”
There have been other fracturing flow tests, but not at this scale. Ten years ago, Halliburton set up a flow loop at its testing center in Duncan, Oklahoma, to see where the proppant exited.
The outdoor setup included the equivalent of three perforations—compared to as many as 48 for the GEODynamics test—and the maximum pumping rate was 14 bbl/min, compared to 90 bbl/min in the recent test.
The 2013 Halliburton paper said the pumping rate ranging from 7 to 14 bbl/min was high enough to keep the proppant suspended, but not high enough to create a safety risk (SPE 163856).
When asked about why the lower pressure was used, the paper’s presenter, Freddy Crespo, then an applications engineer at Halliburton’s Houston Technology Center, said in a JPT story the test setup was not built to handle the pumping rates used for fracturing. “If you go to higher flow rates it will explode.”
Halliburton’s tests, which found that larger sand grains were likely to slip past the first opening and result in large volumes flowing out of later holes, were conducted without incident.
GEODynamics’ test setup showed it is possible to safely conduct surface tests when the pumping rate is 90 bbl/min. Its deceptively simple design was described by Cramer as the work of “a mad genius.”
He was referring to Snider, who is not comfortable with the word genius and pointed out that many of the ideas as well as a lot of motivation came from those working in the field.
“Having a lot of experience in the field and working closely with the field guys is the key,” Snider said. He added that those in the field “were all very passionate about doing it” while engineering people in the office were more likely to question whether it could be done safely.
Safety was a serious concern. The team observed the tests from behind a barrier while looking for signs that the slurry had worn through the thick steel barriers surrounding the casing. They also flew a drone to look for the first signs of leaks.
“Of utmost importance is to clearly state not all the tests were pumped to conclusion,” according to the GEODynamics paper. Tests were shut down “when erosion through both the outer casing shroud and the rubber livestock trough occurred and fluids were beginning to not all be captured in the tanks.”
Maintaining Limits
Cost containment was also critical. Based on their final accounting, backers provided in-kind support of about $5 million for the project, Baumgartner said. That sounds like a lot of money until one considers that a process was repeatedly simulated at a cost which in some cases is equal to the cost of fracturing a single well.
To limit costs, all tests were done at fracturing sites, which offered ready access to fracturing fleets, skilled crews, supplies, and fluid disposal provided by their backers.
The pressure pumper on those early tests, Liberty Oilfield Services, went beyond cooperating with this irregular arrangement. Its Director of Technology Mike Mayerhofer advised them on pumping the test and wrote sections of the paper, Baumgartner said.
The plan evolved as they learned from their mistakes. During the first round, the testing was done after the wells were completed. They learned it is not ideal to ask a crew to pump a test when they need to move on to the next job.
After that they tested during breaks in the actual fracturing. The pipe running to the test stage was connected as if it were a third well with a horizontal frac head. That allowed a quick switchover to testing during lulls in the fracturing work.
Other early lessons learned included adding a drain valve to the tanks after seeing how long it took to remove the fluid with a vacuum truck. And the math required for fluid and sand measurements was a lot easier after they switched from tanks with irregular angled edges to rectangular ones.
The test-stage hardware was off-the-shelf. The casing specifications were based on the requirements of PDC Energy: 5.5-in. 23# P-110 steel perforated with the same hole sizes and spacing as the company used for its wells.
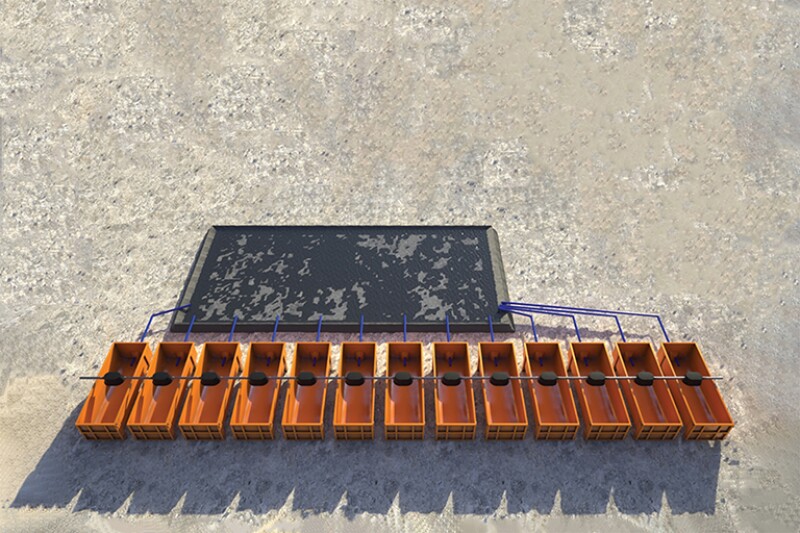
The string of test clusters was strapped on top of a series of large, open boxes, which served as a container for the sand that flowed out of each cluster.
To block the high-pressure slurry steam they surrounded the casing with a heavy-walled 13⅝-in.-diameter pipe, which directed the slurry from that cluster into the container below it.
Surrounding the pipes was what amounted to a splash guard—an upside-down oval-shaped rubber plastic tank. It bore a striking resemblance to the tanks used for watering livestock because it was sold for that purpose at Tractor Supply Company—a chain of farm supply stores which advertises “everyday low prices.”
The low-cost solutions also included brightly colored pool floats and noodles that allowed the tracking of water levels in the tanks from a distance.
The goal was to pump until the containers were nearly full. Afterward they measured the volume of the sand in the tank and the water it displaced. Other sources of data included a pressure sensor on each cluster and the data collected in the frac trailer.
Quick Reaction Times
Problem solving was also required. When an early test had to be stopped because the abrasive slurry cut through the single layer of pipe, they beefed up the barrier.
“The test team regrouped and over a period of a few days procured 1,500 ft of heavy-duty logging chain and fabricated 20-in. casing clamshells to bolt around the logging chain,” the paper stated.
Those barriers proved to be reliable though not impenetrable.
“During these tests, a few of the abrasive high‑pressure slurry streams exiting the 5.5-in. casing were able to eventually erode through 13.625-in. heavy-wall casing, two layers of hardened logging chain, an outer heavy-wall 20-in. casing clamshell, and finally the rubber livestock trough,” according to the paper.
“We never knew where a breach would happen,” Snider said. While the flow in the casing slowed, the force on the casing remains high when the stream of water squeezes through a small hole that was designed to achieve 1,500-psi differential pressure.
After a breakthough, the repair cost of the fix was limited by adjusting the clamshell barriers so the stream would hit a fresh surface. Eventually they also began strengthening the contact surface with hard banding, Snider said.
Things Not Done
In the end, fracturing testing may offer a realistic measure of things that cannot be directly observed downhole, but not a recreation of it.
Some comments and questions from engineers at the conference, which began with praise, led to the use of the word “but.” For example, the presenters were asked if they considered adding hard layers around the casing that would simulate the backpressure created by the cement and rock around an actual well. The testing paper’s authors wrote, “In a perfect theoretical world,” it would be good to know how those pressures affect the outflow.
But recreating the cement and rock around a well presented enormous construction and safety challenges. Baumgartner concluded, “As we explored that possibility through the design process, the cost became astronomically prohibitive.”
That is a problem from Cramer’s point of view because the flow out of the well is significantly affected by the backpressure on the fluid and sand as they push through twisting flow paths into the surrounding reservoir.
The paper also noted the sand pumped was less than what is pumped to fracture a shale well. They pumped nearly 1,300 lb of sand per perforation compared to “over 30,000 pounds of proppant per perforation in our Montney applications,” Cramer said.
Going that big would mean moving up from 31 tons of proppant to something well into the hundreds of tons. A comparison per frac stage is hard to figure because clusters now often have only one perforation, resulting in stages fractured using far fewer than the 48 in the first stage design tested.
When ConocoPhillips considered doing a surface test, the logistical challenges and high costs associated with using that much sand helped convince them not to try, Cramer said.
The volume of sand pumped per minute in the test was far closer than the weight-per-cluster difference would suggest because the pumping had to stop when the storage tanks were full, which usually took around 10 minutes.
For Cramer, whose downhole studies rely on measurements of how much perforations in the ground erode over 2 hours or so of pumping, that can widen the hole from front to back and result in a surge in flow capacity. In comparison, the surface wear he saw on the GEODynamics samples was minor in comparison.
“Projects based on surface testing are inherently limited,” he noted, adding, “The most critical insights have been and will continue to be obtained by study of actual treatments featuring downhole measurements of perforation entry holes [before and after treatments], augmented with treating pressure analysis and fiber-optic measurements.”
A paper describing the methods he mentioned, including an example where one of the perforations in the last of six clusters [toe side] took in 25% of the proppant based on the post-frac analysis, was presented at this year’s HFTC (SPE 209184).
The excessively large size of the toe-side perforation indicated it received “a disproportionate share of the proppant” which the paper said could have been “due to proppant inertia.” The paper added, “This behavior was not commonly observed in the rest of the well.”
Those running the GEODynamics project acknowledged the value of downhole studies, with member companies contributing studies based on their analysis of fracturing data to add subsurface perspectives to surface results.
Figs. 1–4 show how the sand was distributed among the clusters in a test stage on the surface that made it possible to measure how much flowed out of each cluster (SPE 209141).
Check It Out
Both sides in the discussion agree that more attention needs to be paid to proppant and where it goes.
Cramer said the industry needs an updated model for predicting the proppant and fluid flows among perforation clusters and hydraulic fractures. As evidence, he notes that a model he developed in 1987 is still in use. ConocoPhillips is now part of an eight-company joint industry project seeking to do so.
Both also agree that companies need to pay closer attention to whether the sand being bought meets their specifications.
Based on the sand used while fracture testing, Snider said there were “some radical differences in sand quality.” An observation was that extremely angular sand grains are more abrasive than rounded ones and could speed the erosion rate of pumping equipment and perforations.
Their tests showed larger 40/70 mesh is more likely to slip past earlier stages than 100 mesh; but in practice, the size of the grains sold as 40/70 and 100 mesh vary widely and can overlap.
For example, 100 mesh is defined as a mix from 70 to 140 mesh, but that is not established by an industry standard. The delivered sand can be a mix concentrated in the higher or lower end of that range and even well beyond its boundaries.
Cramer has been studying differences in the actual and promised size range of proppant from mines, some of which are far closer to the specifications than others.
His concerns include particles that are 50 mesh or larger because they can cause bridging—essentially self-assembling into a structure that can block near-wellbore flow channels like a diverter.
The GEODynamics group did a total of 20 rounds of tests considering variables such as large-sized proppant, lower pumping rates, and whether proppant flows out more evenly when the perforation hole is shot on an angle, like an off-ramp on a freeway. They would like to present a paper on later tests, such as the impact of pumping larger-sized proppant or lower pumping rates.
Based on the two papers, it is logical to assume that the bigger the proppant size, the more would slip to the toe side of the well. But based on past experience, don’t place any big bets on that.
For Further Reading
SPE 209141 Execution and Learnings From the First Two Surface Tests Replicating Unconventional Fracturing and Proppant Transport by Phil Snider and Steve Baumgartner, GEODynamics; Mike Mayerhofer, Liberty Oilfield Services; and Matt Woltz, PDC Energy.
SPE 209178 Modeling Proppant Transport in Casing and Perforations Based on Proppant Transport Surface Tests by Jack Kolle, Oil States Energy Services; Alan Mueller, ACMS; Steve Baumgartner and David Cuthill, GEODynamics.
SPE 201376 Pumpdown Diagnostics for Plug-and-Perf Treatments by David D. Cramer, Jon Snyder, and Junjing Zhang, ConocoPhillips Company.
SPE 163856 Proppant Distribution in Multistage Hydraulic Fractured Wells: A Large-Scale Inside-Casing Investigation by Freddy Crespo, Nevil Kunnath Aven, and Janette Cortez, Halliburton; M.Y. Soliman, Texas Tech University; Atul Bokane, Siddharth Jain, and Yogesh Deshpande, Halliburton.
SPE 209184 Driving Completion Execution Improvements Through Detailed Analysis of Acoustic Imaging and Stimulation Data by Mark Watson, Mitch Schinnour, David D. Cramer, and Matt White, ConocoPhillips Company.