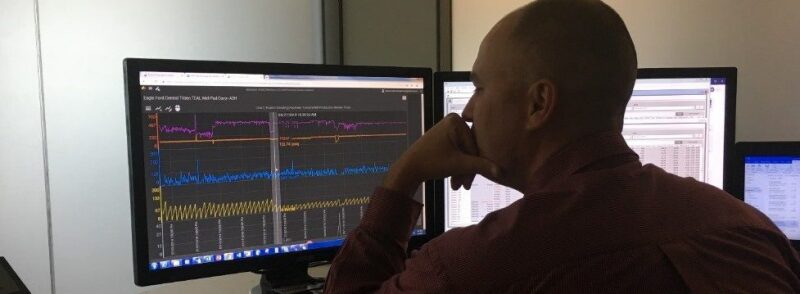
In 2018, Murphy Oil (NYSE: MUR) launched a global initiative to open-source all internal live streaming data to its engineers. The process led it to implement a global data historian tool, called Canary, and a corresponding visualization tool, Axiom (Fig. 1). The insights provided by the digital analytical tool are shaping the future of operations at the company.
Canary Labs’ historian captures all real-time data across all business units and consolidates it in the AWS cloud. The live data can be manipulated easily to visualizations/dashboards within minutes and deployed with a URL. The result is a complete picture of operations at Murphy that empowers operators, engineers, and managers to improve their processes, increase quality, and enhance operational efficiency.
The Search for an Innovative Solution
Canary Labs’ historian was instituted after a constructively critical discussion with an operations manager from Murphy’s onshore business unit. The purpose of the conversation was to assess existing processes considering Murphy’s new corporate mission, vision, and values. The dialogue signaled a need for an automated business solution that would simplify the storage and analysis of time-series data.
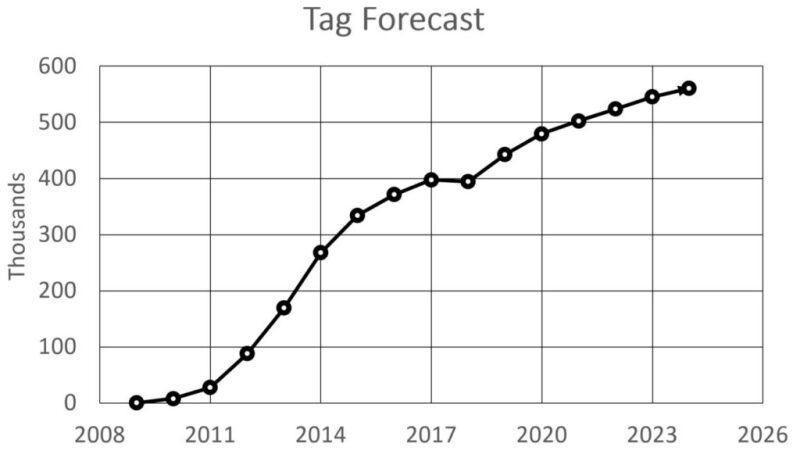
Eric Hambly, executive vice president of onshore at Murphy, said, “There was a growing demand for clean data that could be quickly linked across all data sources and easily accessible in digital format. We were ready to shift our focus from cumbersome data management toward more advanced functions and insights.” For North American onshore operations, it was business critical to sort out a data historian early on. With a growing well count, the tag count is forecast to surpass a half-million by 2025 solely from the company’s Eagle Ford Shale CygNet supervisory control and data acquisition (SCADA) system (Fig. 2). Murphy’s big data strategy ultimately relied on the data historian strategy.
A technology team quickly mobilized to examine digital products. The tool by Canary Labs was selected as an innovative solution that aligns data systems with business operations.
Francisco Ruiz, Offshore Facilities and Maintenance Team lead at Murphy, said, “Our people are receptive to new ways to improve work flows using new technology. They want to keep challenging themselves and staying ahead of the curve. They quickly realized the value of the tool and are now driving the initiative.”
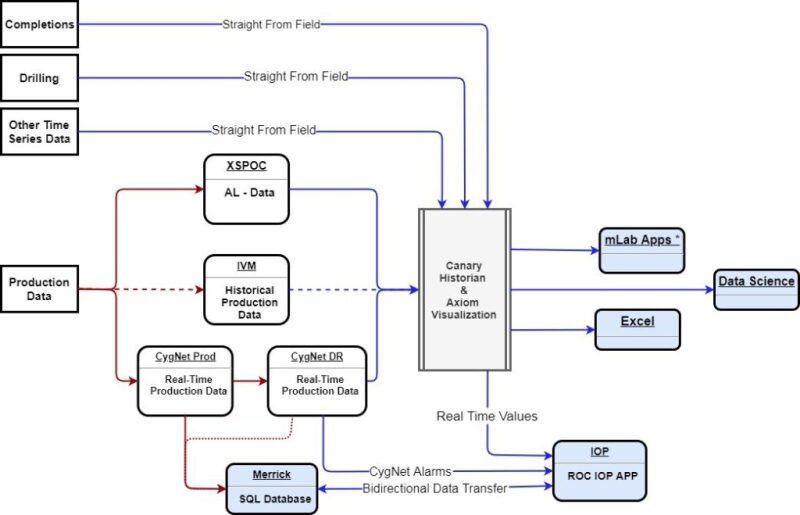
The data historian was launched in Murphy’s Eagle Ford Shale and subsequently implemented in the Canadian business unit. Thomas Nix, SCADA analyst at Murphy, said the goal is to populate the tool throughout the rest of the business units (Fig. 3).
“As Murphy becomes more data-driven, Canary’s tool will grow as a vital necessity,” Nix said. “Axiom is a big part of our vision.”
A Global Data Historian
At its core, the historian functions as a continuous data historian that is driven by user demands. The tool digests data from various points in time and from various regions, business units, and software across Murphy.
People initiate the process by creating tags that name data points and by creating algorithms that convert existing tags to Canary tags. The tags automatically feed pieces of day-to-day operations into a single, proprietary database, where real-time and historical data are consolidated, leveled, and stored. In 2018, more than 100,000 tags were created at Murphy, the majority of which were pulled data from CygNet (the SCADA system that manage well pads and facilities data). This was followed by 50,000 tags from the XSPOC system (the SCADA system that manages the rod pumps). The Montney asset in the Canada business unit was integrated next under the same nomenclature to adhere to a global standard.
Tyson Trail, Montney production engineer at Murphy, said the tool revolutionizes data accessibility and storage. “We’re no longer handcuffed by the software we use,” he said. “The more we use Axiom, the more we’re discovering advantages. The sky is the limit for our possibilities.”
The simplicity and ease of the data historian is helping to generate an increasing amount of relevant data at Murphy. One aspect is the hosting environment. Because the high-performance system is managed in the cloud, Axiom is a robust solution that provides around-the-clock speed and reliability with minimal administration. Another aspect is just-in-time training, which provides rapid on-boarding for new users, even those with little or no technical knowledge.
Benny Singh, manager of data analytics and solutions at Murphy, said, “This is a collaborative effort in which the technology side of operations and the business side of operations come together to work effectively. We truly have the power of data in our hands now.”
A Big Data Analysis Tool
Beyond its function as a global data historian, Canary is connected to Axiom, a data analysis tool. The raw data that is pulled into the database is quickly aggregated and transformed into visuals for the purpose of analyzing trends and assessing performance.
The functionality of the internal visualization tool exceeds that of traditional software. Multiple values associated with each of Murphy’s wells are connected through charts, graphs, and diagrams replicating the flow of facilities, all of which provide a critical snapshot of well performance over time. On the basis of the high-frequency data, Murphy can identify and monitor multiple trends instantly.
Ruiz said, “Axiom standardizes how we visualize data. We can now visualize any value—whether it is pressure, temperature, oil level, water level, battery voltage, or running status—on any piece of equipment or facility. Our end users have access to all of the data in a simple, easy manner, which motivates them to be proactive in utilizing the program.”
Additional capabilities allow the overlaying of multiple events to spot anomalies easily as well as export data for later analysis. Trends can be compared with their previous historical values or calculated for future possibilities. And, with the touch of a finger, users can view more-detailed attributes at a specified location across a trend area. Thus, people are equipped with a big-picture perspective as well as the ability to narrow in and pinpoint any small blip in performance.
A game-changing feature for Murphy personnel is the ability to create unique custom dashboards. Users can build from templates, manipulating visuals so that data is presented according their team’s needs and preferences. Nix said the intuitive drag-and-drop design provides freedom, particularly for engineers.
“Engineers can create their own reports targeting specifically what they want and how they want to see it,” he said. “They no longer have to wait on the drilling teams or SCADA department to make it happen.”
Users have the flexibility of designating privacy levels for their custom visuals. Charts may be saved in private user folders or made available in public folders that can be shared with people across the company, including annotations on trends that are visible to all. Whether private or public, the data remains agile with end users. While some people access their data on desktops, others in the field modify and deliver content from their mobile devices. The data is available for analysis anywhere, at any time, thanks in part to the information technology department working with Canary to host the server on AWS and integrating single sign on.
For more-advanced users, the Canary Labs’ Rest API is easily accessible via Python/R scripts, which allows for advance artificial intelligence (AI)/machine learning (ML) application, along with building any software layer that sits on top of the rest API. “With AI/ML running in the background assisting in the optimization of wells and central facilities, such as the Murphy’s experimentation with EOR [enhanced oil recovery], this will provide our engineers time for finding more innovative solutions to produce more oil,” Nix said.
The Effect on Operations
Ultimately, the purpose of Canary’s data historian and trending tool is to improve operations. An immediate effect has been increased efficiency with the company’s time, cash flow, and resources. The data process that once was monitored by a third party now is handled in house. The dashboards that once took months to build and the daily checks on well performance that took hours to complete now both take only minutes. Information is getting into the hands of engineers as quickly as possible.
Katy Arnst, artificial lift engineer at Murphy, said the success of the big data strategy is in the details. “The endless clicking to look at each well has been streamlined to just one click in Canary,” she said. “You wouldn’t think navigation buttons could have such an impact on our time, but, when you’re looking at 360 wells, it gets cumbersome. The small things make a big difference in our ability to quickly assess performance.”
The increased efficiency allows Murphy to concentrate its efforts on optimizing well performance. Axiom takes away the noise of thousands of field measurements, distilling the information to only the factors that users are targeting at that moment. Without the limitations of traditional software with prebuilt trends, the tool allows them to consider new combinations of factors and to examine broader trends. This new representation of data introduces new possibilities and solutions (Fig. 4).
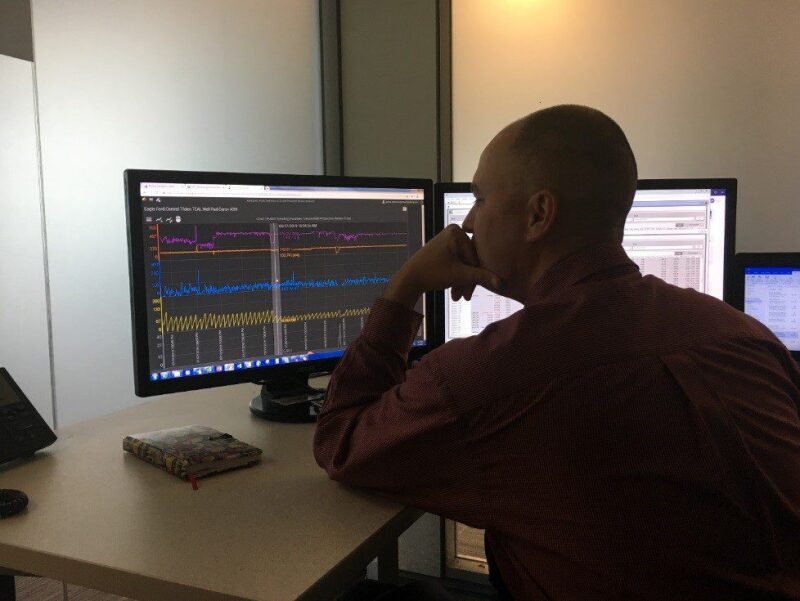
monitors Axiom to conduct well optimization.
This is precisely how Axiom won over Karey Knackstedt, the Facilities Team lead’s support, who said, “As facilities lead, every morning I need to be aware of what’s happening in more than 30 central facilities that we are operating. I had a very specific request on how I wanted to visualize the operations. We were able to deploy a very customized dashboard in a couple of weeks. Trend lines can convey the whole story for past 24 hours or trends over the past 6 months as opposed to a single point displayed by value boxes. With the ability to quickly trend any of the parameters displayed, I have been able to substantially reduce the time it takes me to review through each of the facilities and ask the engineers and operations the right questions. This tool has empowered our field personnel to also engage our engineers in more meaningful discussions for optimization” (Fig. 5).
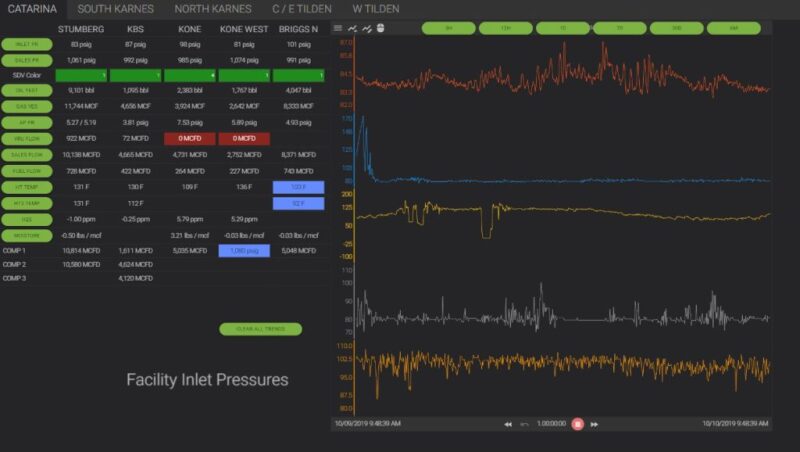
to drive morning call conversations.
The clarity and insight are helping engineers and operators make confident, data-driven decisions. They no longer discuss speculations and lagging parameters. Today, they are leveraging the visibility of real-time data and trends from facilities, looking for critical leading indicators to determine root causes, discern patterns, and make rapid adjustments for the prevention of issues. As a result, Murphy is producing optimal outcomes, including setting realistic production goals, maximizing uptime, and ensuring safety.
In 2019, Murphy embarked on a new initiative to integrate the entire real-time 1-second drilling and completion data into the Canary Historian. This is a monumental challenge, not only because of the sheer quantity of data but also because of the need to normalize historical data from various vendors. For example, completion data is estimated to contain more than 1,500 unique tags names. By using a middle layer in Microsoft SQL Server in the Canary historian, these tags are normalized to just more than 90 tag names (Fig. 6).
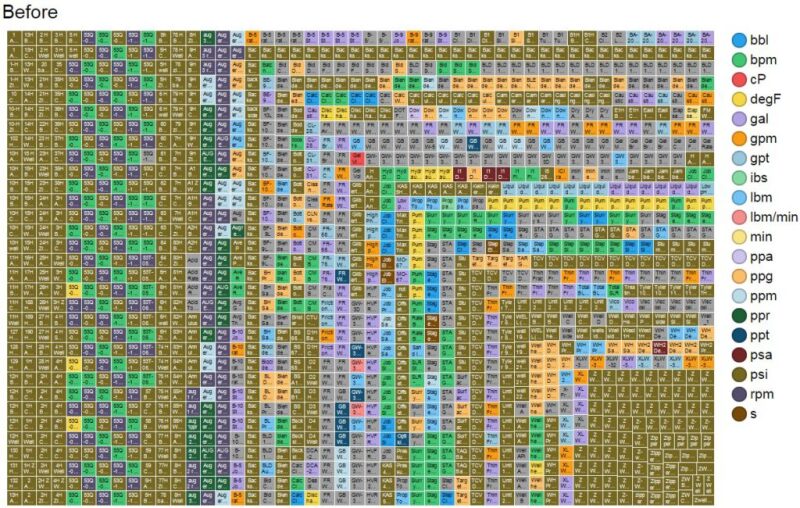
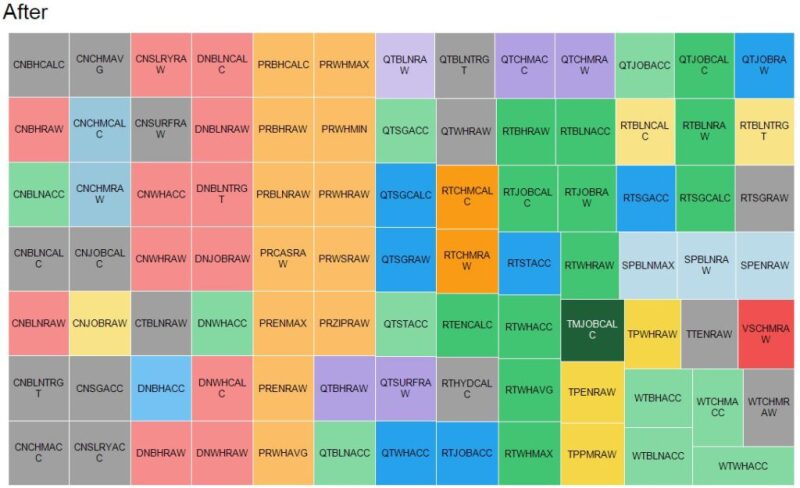
Fig. 6—More than 1,500 tag names before normalization (a)
were reduced to just 90 tags (b) after normalization in the Canary historian.
“We’ve progressed from relying on data gurus to normalizing the data and equipping data users in an approachable way,” Hambly said. “It’s causing a thirst for more, faster, real-time data. The journey is exciting—and there’s more to come as we zero in on our most critical information.”
Francisco Ruiz, Offshore Facilities and Maintenance Team lead at Murphy, has more than 13 years of experience in the oil and gas industry, with experience in capital projects and operations. He holds a bachelor’s degree in chemical engineering from Instituto Tecnologico y de Estudios Superiores de Monterrey.
Thomas Nix, SCADA analyst at Murphy, has worked with SCADA systems and data historians in the oil and gas industry for 9 years. He holds a bachelor’s degree in aerospace engineering from Embry-Riddle Aeronautical University and an MBA degree from the University of St. Thomas.
Huzeifa Ismail, research data scientist at Murphy, has more than 10 years of experience addressing challenges for the oil and gas industry in the area of engineering and data science. He holds bachelor’s and master’s degrees from Brandeis University and a PhD degree in chemical physics from the Massachusetts Institute of Technology. Ismail has authored numerous technical articles and patents.

