When Murphy Oil (NYSE: MUR) underwent a significant portfolio transformation in 2019—two acquisitions and one divestment—it was accompanied by a continued technical approach to production and operations management (Fig. 1). Within 6 months, the balanced crude oil and natural gas exploration, development, and production company worked across its assets to create a tool called the Global Downtime Report (GDR).
The GDR is proprietary software that provides a global perspective of operational downtime data. The application focuses on the nonproductive time (NPT) related to drilling, completion, and production operations, and analysis of data is already delivering positive results for Murphy.
Concept Development
The concept was developed while assessing existing work flows and tools used across Murphy’s assets. It quickly became apparent there was a need for a consistent global visualization of NPT data to identify areas of concern and improve operational downtime. Integration of cross-functional work flows from engineer to the C-suite drove efficiency in data collection and analysis as nomenclature was aligned, input categorizations were standardized, and reporting was amalgamated.
Understanding performance, establishing measurement criteria, and providing the ability to compare benchmarks were critical to reach the goal of identifying and implementing process improvements to improve Murphy’s bottom line.
Coordination for Standardization
One of the key challenges of the project was to reach global alignment to consistently roll up, categorize, and report NPT. Twenty-four employees from eight teams across five business units came together to deliver the solution (Fig. 2).
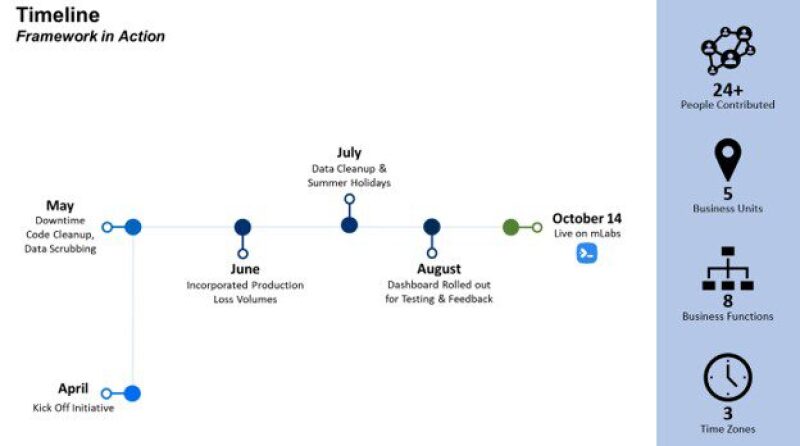
established by the business unit.
Mark Mick, Murphy’s country manager for Vietnam, helped lead the initiative by leveraging existing tools and mapping existing information. “We did not want to reinvent the wheel or interrupt on-going operations,” he said. “We wanted a manageable approach. There was already a lot of data-tracking within our legacy systems, so we began by asking, ‘What is working, and what gaps do we need to close?’”
The initial task was to agree on a methodology of standardizing the multitude of operational downtime codes. Murphy had documented approximately 300 unique production-related downtime codes across eight different databases, which resulted in inconsistent definitions of downtime events among individuals and across business units. Many downtime codes described similar events. For example, the impact of inclement weather might have been coded as “weather” by one person or could have been entered as “tropical storm” by another. Some codes dealt with very specific production interruptions such as third-party programs, and others were often complicated by determining if an event was planned or unplanned. The teams needed to negotiate and reconcile their definitions for consistent, accurate reporting of NPT across the company.
The standardization of codes was achieved through a multitier categorization in each of the following two business functions: Drilling and completions and production operations. This ultimately led to a normalized consistency between the company’s onshore and offshore businesses. Also, this new tiered model allows for activity-specific NPT to be evaluated from the well level to a total company overview.
The drilling and completions codes consisted of two tiers. Tier 1 coding was defined between productive and nonproductive time. All time is classified one way or another, and if it is nonproductive, then Tier 2 is used to provide further details. Tier 2 NPT codes (Table 1), were limited to fewer than 10 more-descriptive codes such as “weather,” “downhole,” and “rig contractor.”
| Tier 1 | Tier 2 |
|---|---|
| Downhole | Downhole |
| Nonproductive | External |
| Operating Company | |
| Rig Contractor | |
| Service Company | |
| Weather |
Production preparations downtime codes were mapped through a more-detailed three-tier structure. This business function’s Tier 1 codes first characterized the downtime as planned or unplanned, and then as Murphy-operated or third-party. One specific challenge of the project was agreeing on the definition of what work was planned vs. unplanned. Ultimately, for the purpose of the GDR, planned events were those that were included in a business unit’s approved annual budget forecast (e.g., shutdowns, preventative maintenance, planned well work).
Tier 2 downtime codes were mapped to categorize the downtime events of the specific activities (e.g., maintenance at the well, construction, offsets frac, weather). Tier 3 codes added an additional level of specificity to further delve into operational granularity (e.g., line pressure, gas compression). Importantly, the 300+ production downtime codes were mapped to a significantly reduced 55 new codes to enhance focus on areas for potential improvement (Table 2).
| Tier 1 | Tier 2 | Tier 3 | |
|---|---|---|---|
| Planned, Internal | Construction | Abandonment | Low Reservoir Pressure |
| Planned, External | Export | AP Pump | Maintenance |
| Unplanned, Internal | Maintenance, Surface | Approvals | No Market |
| Unplanned, External | Maintenance, Well | Artificial Lift | No Pipeline |
| Offset Frac | Atmospheric Seperator | Pigging | |
| Other | Casing | Pipeline | |
| Regulatory | Check Valve | Power | |
| Reservoir Management | Chemical | Produced Water | |
| Surface Equipment | Completion | Production Optimization | |
| Weather | Compressor | Restriction | |
| Dehydration | Road | ||
| Electrical | Safety Equipment | ||
| Enforced Action | Sand | ||
| EOR | Separation | ||
| ESD | Startup | ||
| Flare System | Study | ||
| Flooding | Sump | ||
| Flow Assurance | Tank | ||
| Flowline | Well Testing | ||
| Fuel System | Tubing | ||
| Gas Cap | Turnaround | ||
| GOR | Uneconomical | ||
| Heater Treater | Weather | ||
| H2S Treatment | Wireline | ||
| Hydrate | Workover | ||
| Impurities | X-mas Tree | ||
| Instrument Air | |||
| Line Pressure | |||
| Loading |
As the data was cleaned and organized, Mick relied on continual feedback from the team to lead the design of a dashboard for the GDR (Fig. 3). Its structure reflected the hierarchy of common downtime codes for accurate reporting that met everyone’s needs. “I’m proud of the positive engagement of our team,” Mick said. “From management to IT, everyone rallied to complete action items, hit milestones, and rapidly delivered data on a global scale.”
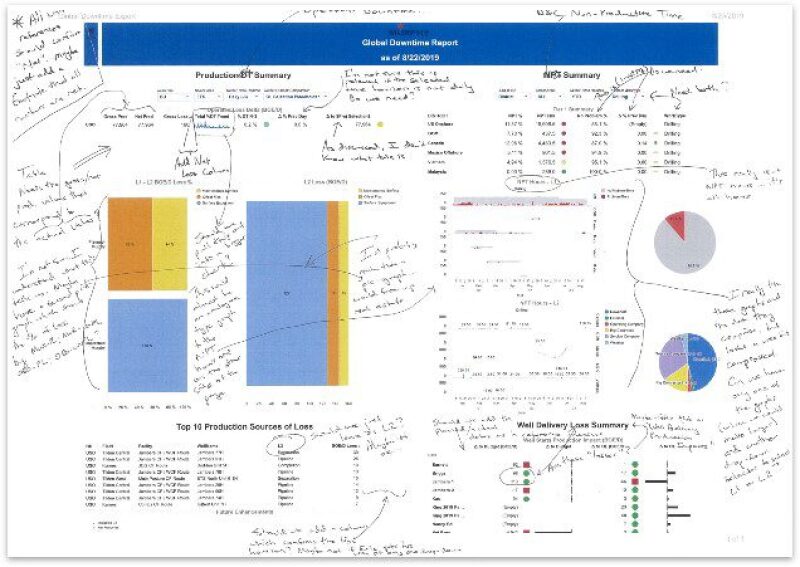
throughout the design of the dashboard.
Kiran Polamarasetty, information technology solutions architect at Murphy, said, “Every team had its own strategies and classifications for downtime labels. We listened to the reasoning behind each code, which helped bridge differences among the onshore and offshore businesses, production operations and drilling and completions, and supervisors and managers. It took time to understand each label, but we looked for common ground to find global definitions that made sense to everyone.”
These discussions contributed to the creation of the dashboard, a portion of which can be seen in Fig. 4, that would be insightful to all business units involved, such as onshore and offshore teams, production operations, drilling and completions, and supervisors and managers.
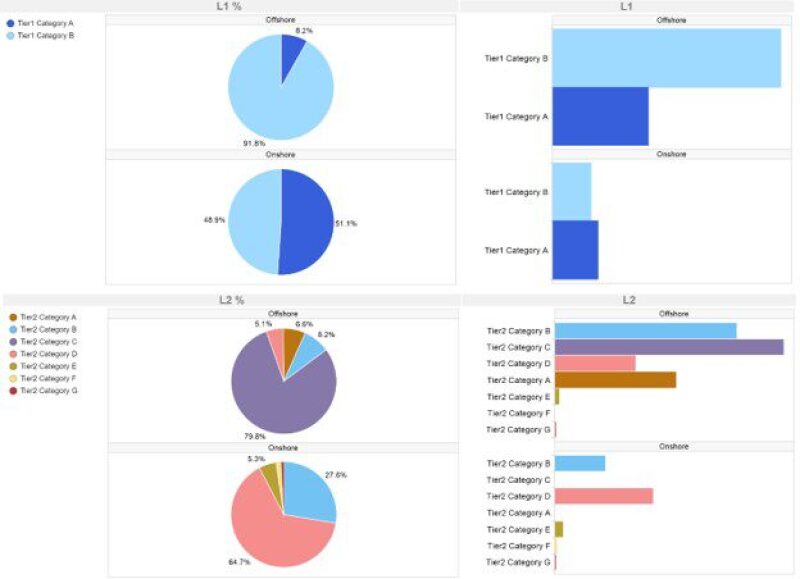
from multiple business units such as onshore and offshore teams,
production operations, drilling and completions,
and supervisors and managers.
In October 2019, 6 months after conception, the GDR went live across Murphy, as per schedule. The standardized application was both highly functional and visually attractive. The downtime codes were reduced by more than 60% and grouped into a succinct, tiered system of general parent codes and granular child codes. The newly aligned data was presented in sleek, streamlined visualizations in one global dashboard.
Visibility and Clarity
At the push of a button, dynamic, user-friendly reports provide real-time visibility of fact-based information from the field to the boardroom (Fig. 5). Utilization of the GDR is squashing myths and separating perceptions, leading to more informed analysis and decisions. The visibility provided by the GDR is increasing the clarity into the root causes of downtime and reveals repeat offenders that cause significant losses over time.
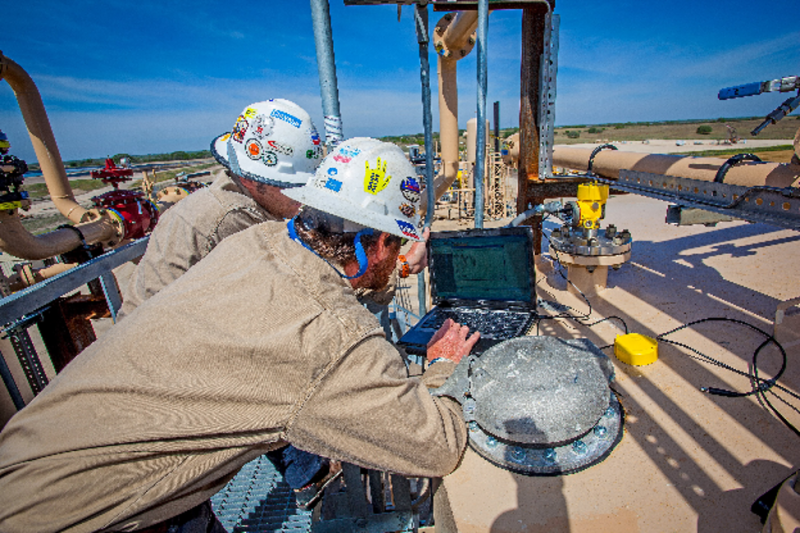
investigating downtime.
Helen Holder, a senior production engineer at Murphy, said, “Information is no longer siloed; all data in the dashboard is transparent. Management can easily see a big picture in morning meetings of what’s happening in real time across the company. We can control whether we see downtime by business units, areas, or more detailed views at the facilities level. This is the best we’ve ever understood our downtime.”
In addition to vertical use, the GDR communicates valuable information horizontally among peers.
Grant McLean, a senior production technologist at Murphy, said, “I like being able to see what other groups are doing and who is performing best in certain areas. It’s interesting to see where other assets are having successes and challenges, and vice versa.”
McLean also noted that the digital tool is increasing a sense of ownership and accountability. “The GDR is motivating the people who enter the data. It’s being viewed regularly and globally, so they’re putting a greater level of care in the numbers and the integrity of downtime code entry using best practices. The GDR validates everyone’s efforts as worthwhile.”
The time factor is also a critical function of the GDR. The tool provides a percentage of downtime relative to a time period for the purpose of improving Murphy’s operational performance.
Data Specialist Solimar Rojas said, “Not only can we define which asset or field we want to see but we can also view specific codes over a time horizon: yesterday, month to date, year to date. Colored metrics allow us to easily identify losses over time, monitor KPIs, compare with future projections, and facilitate understanding on performance.”
Business Analyst Keyur Patel said, “We wanted to affix a value perspective to quantify downtime, one that was more informed than traditional reports. So we studied well performance over several days to produce an average daily output. From there, we were able to calculate the value of uptime as well as any potential loss over time.”
To ensure the validity and accuracy of all calculations and reports, the data is scrutinized. Patel said that the calculations are used in more ways than simply production losses. “We can observe whether a well is performing at or above its target, taking into account production curves, and apply those lessons learned to other wells,” he said.
Prioritization for Effect
Murphy’s goal is to improve continuously and to be the best in delivering oil and gas in a safe, environmentally responsible manner. The tool helps to make immediate improvements to processes by attacking the opportunities that yield the greatest effects. The standardized data provided by the GDR leads to more-immediate corrective action items of the most significant factors contributing to downtime.
With the implementation of GDR, the ultimately goal is to gain capital efficiencies in drilling and completions operations and improve profitability in production operations.
Data Science Analyst Laura Naaykens said, “Data is instantly transformed into pie charts and easy-to-use visualizations. Impacts are denoted by the colors of a traffic light for a quick overview. Users can compare the data against multiple targets, such as monthly or yearly budgets, and toggle between the current forecasts and the previously set annual budget targets. And the top downtime factors are featured in a David Letterman-style top ten list for easy deciphering. The GDR is a very clean tool that works for so many people in daily decision-making and business improvement.”
Molly Smith, Murphy’s general manager for drilling and completions, said, “Never before have we had one dashboard linking NPT on drilling and completions operations to production delays from new wells. This holistic look at our business has enabled us better forecasting in advance of new wells coming online.”
Confidence in Forecasting
The standardization of NPT is reducing global downtime at Murphy. The process work flow has been highly improved and streamlined, as depicted in Fig. 6. In turn, the initiative is increasing the confidence of Murphy’s staff that they are acting on the right priorities and delivering value. And now, using historical data, Murphy employees can prepare better for the future. The GDR is enabling people to anticipate failures more accurately, justify projects, and forecast production.
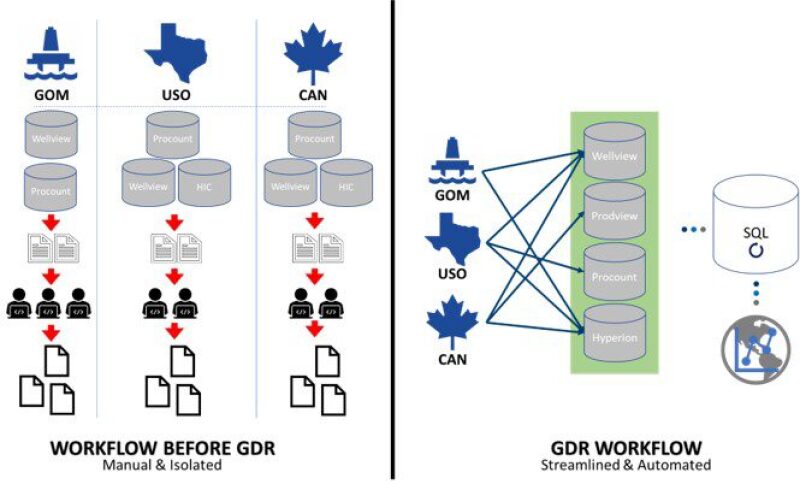
and standardization of work flow.
With this new tool, Murphy was able to improve specifically in Tier 2 categories by as much as a factor of two by optimizing controllable downtime (e.g., optimizing well delivery schedule, facility turnaround, and workover schedules) to help ensure delivery on the company’s production targets. Ultimately, this is not just a reporting tool. It’s changing how data is entered—with accuracy, accountability, and ownership. And it’s changing the decision-making process—with clarity and confidence. The GDR is changing the culture and results at Murphy.
Laura Naaykens, Data Science Analyst, Murphy Oil, has been a change agent within the North American onshore operations for 4 years, leveraging tools and modern techniques to improve day-to-day work flows with a focus on creating a community of practice in data science.
Mark Mick, Country Manager, Vietnam, Murphy Oil, has more than 20 years of industry experience, having worked in a number of different engineering and senior leadership capacities in both onshore and offshore environments and in several different locations around the world. Mick holds a BS degree in environmental geology from Boston College, an MS degree in chemical engineering from the University of Dayton, and an MBA degree from the University of Houston.
Huzeifa Ismail, Data Scientist, Murphy Oil, has more than 10 years of experience addressing challenges for the oil and gas industry in the area of engineering and data science. Ismail holds bachelor’s and master’s degrees from Brandeis University and a PhD degree in chemical physics from the Massachusetts Institute of Technology and has authored numerous technical articles and patents.

