
Data are the backbone of what Klaus Schwab—the founder and executive chairman of the World Economic Forum—proclaimed to be the Fourth Industrial Revolution. This 21st‑century revolution is one of connectivity, advanced analytics, automation, and manufacturing technology.
While the road to this high-tech revolution started long ago with the use of water and steam to power mechanized production, it was electricity’s ability to power mass production that delivered us from the first to the second industrial revolution.
Electronics and information systems necessary to automate production ushered in the third revolution. The data and our abilities to decipher and extract value from these seemingly random and disparate patterns of numbers and letters to create actionable intelligence is rapidly transforming the way business is conducted.
Data are everywhere and in everything. But on the grand scale of time, the collection, analysis, and application of digital data is relatively young.
Billy Bean and the Major League Baseball team Oakland Athletics, for example, demonstrated the importance of data-driven decision making in the early 2000s by leveraging the power of data analytics to go from last place contender to chasing the championship in what has become known as Moneyball.
Some 20 years later, the power of data and digital continues to evolve, with the bright lights of Qatar’s Lusail Stadium, for example, shining down last month on the final football match of the FIFA World Cup; every movement made by Al Rihla was captured, stored, and analyzed.
But Al Rihla was not a player; it was the football created by Adidas and used in each of the more than 60 matches held throughout the tournament with an internal sensor for real-time ball tracking capabilities. High-speed cameras and antennas surrounding the football pitch provided additional support, feeding data into FIFA’s enhanced football intelligence service.
The data collected during the matches were analyzed on a variety of metrics like possession time, line breaks, pressure on the ball, and forced turnovers, and then shared with teams with the goal of improving the game and its players.
Winning the “beautiful game” is not as simple as it looks, as there’s more to kicking the ball into the opposing team’s net to score a goal as many times as possible in 90 minutes. These data offer an inside look into the processes of success or failure.
Simple, too, is the production of oil and gas when explained on paper: drill a hole into the ground, route what flows to the surface into a pipeline, and then get paid for the effort invested in delivering that resource to the market when the price is right.
It is more complicated than that, and data are playing an important role in delivering production increases and more.
Data powered the shale gale that swept across the US oil and gas industry. David Millwee, vice president of drilling performance for Patterson-UTI Drilling, credits data for helping to deliver the yearly increases in the lateral footage drilled.
“In the Delaware Basin in New Mexico, an average rig in 2014 would deliver about 43,000 to 45,000 lateral feet of production footage to an operator. In 2016, that same rig was doing 63,000 lateral feet per year. It’s basically a 50% increase in 2 years,” he said, adding that in 2019, right before the market crash, that rig was delivering 93,000 to 95,000 lateral feet.
“When we looked at the numbers at the end of 2021, that rig was delivering about 150,000 lateral feet in 2021. Looking at that year-over-year, back to 2014 when the US was running 1,800 rigs at 43,000 lateral feet, to today where we’re in the mid-700s rigs, delivering almost four times that rate. You could say we have a rig count today around 2,800 as compared to 2014,” he said.
Having access to the data, Millwee said, allowed the company to identify areas in which limitations or inefficiencies were preventing optimal performance.
“We were able to then go back to our customers and work with them to continuously drive improvement,” he said. “Having access to the data, and making sure we’re looking at the right information, helped to identify the right targets to attack, then measure the results and repeat the process. It’s a continuous improvement loop that will never stop.”
Challenges persist, opponents and components tire out, and victory goes to the team that outlasted the other or got the highest price at the market.
Each of the preceding industrial revolutions were made possible by oil and gas with its replacement of coal as a primary fuel source for power generation. A common thread connecting North America’s baseball to the World Cup’s football to the oil and gas industry are the massive quantities of data each capture and store.
There have been significant steps taken by the oil and gas industry across all its sectors, and while some of those steps were made by the supermajors and are more widely known, the advancement of the industry on its data journey is one with room for all, regardless of company size.
Small Operators Simplifying the Complex
Think of an E&P company like a professional sports team, its players are the wells. From rookies ready for drilling and completion to active players on production, or seasoned veterans on their second or third round of artificial lift, each well comes with copious amounts of data baggage needing a home and a plan to deliver returns.
Putting the immense amounts of data coming out of the world’s oil and gas fields to work is a significant challenge that the industry is tackling.
It is not a simple process for even the largest of operators and it also represents a fundamental change in how companies do business, which Datagration Chairman and Chief Executive Officer Peter Bernard said is necessary if a company is to evolve.
PetroVisor, Datagration’s patented software, copies data from multiple sources and brings it together under one unified data model to help companies make economic and operational decisions. PetroVisor users have seen up to 70% reduction in time spent organizing data, the company said.
“This led to significant decreases in overall project time, increased capital and operating efficiencies, and higher production per dollar spent,” Bernard said. “Companies must be agile and able to generate superior financial performance with minimal resources to survive. Digitalization is key.”
A pair of privately held Texas operators—Steward Energy and Texas American Resources Company—are currently implementing PetroVisor into their operations and have realized early successes throughout the process.
Frisco, Texas-based Steward Energy is an independent E&P company holding more than 70,000 acres in the Permian Basin of Texas and New Mexico, with a particular focus on conventional oil fields in the Northwest Shelf.
The company started working with Datagration on the implementation in January 2022. Steward Energy currently has 199 producing horizontal wells, 1 producing vertical well, and 20 saltwater disposal wells.
Scott Stedman, chief development officer for Steward Energy, said that the company’s leaders realized it is very good at collecting data, but there was room for improvement when it came to analyzing the data to the company’s benefit.
“We made several efforts at drawing conclusions from our completion data, but those efforts were basic and did not yield any results. Regarding artificial lift, the time to ESP conversion to rod pump is critical to us, as it is a large expense reduction and reduced cost of future pulls. To date, this is determined by engineering surveillance,” Stedman said, adding that they are working with Datagration to automate this process.
“We are also finalizing a company performance dashboard showing production expenses and more on a corporate level, all in one place. This work was not done before using a different method, we just had to go back and forth between data sets,” he said.
According to Stedman, the company is finalizing implementation of PetroVisor, but they have had early success with ad hoc projects.
“The platform has been very helpful using techniques that we would not have been able to duplicate on our own. Notably, we had to deliver gas forecast estimates to our third-party midstream partner to gain approval for a large gas plant expansion,” he explained.
“PetroVisor was able to pull in all our production data and create area-specific gas forecasts. This was much more precise than previous methods using estimated gas-to-oil ratio and oil type curve volumes to develop a forecast. As we are a solution gas drive reservoir, gas forecasts can be very difficult as different types of wells (offset or not) produce gas at vastly different rates.”
Austin, Texas-based independent E&P company Texas American Resources Company holds acreage across the Eagle Ford Shale and Austin Chalk producing regions, with 219 oil‑ and 1 gas‑producing wells in Atascosa, Frio, and La Salle counties.
David Honeycutt, founder and chief executive of the company, said that the implementation of PetroVisor into operations should be complete by the first quarter of 2023. The rollout comes at a time when Texas American also has been upgrading its production infrastructure and electrifying its operations.
“PetroVisor is going to be really helpful for us with ESG, to tangibly demonstrate the before and the after benefits of our massive electrification project,” Honeycutt said. “The environmental footprint will be better, and so too will the functionality.”
Honeycutt said that the company uses multiple software packages, with the team doing the work in the platform for their discipline. With PetroVisor, there will no longer be siloes.
“All of the data will be collected, and we’ll be able to draw from them all. Before, we were dependent on the people in that discipline to do their work before we could see the work product. Now we can pick an integrated workflow from the data off these other platforms. You can see the overall performance of your production and can run diagnostics in real time to reduce the percentage of downtime in your operations.”
Digital Twin Delivers an Inside View
Data analytics can help an E&P company better understand the reservoir formations it pursues while maximizing production. Data also are key to monitoring facility and equipment performance, flagging anomalous conditions that could result in system damage.
Hess Corp. is an early adopter of the use of data analytics to enhance its E&P efforts. From 2014 to 2016, the company, through its use of proprietary algorithms, predictive analytics, machine learning, and automation, significantly optimized its drilling programs in the Bakken Shale, increased its operational efficiencies, and delivered a reduction in cash operating costs by 32%, according to a 2017 presentation.
Dryonis Pertuso, senior advisor of applied data analytics for Hess, said the company is committed to using digital technologies to enhance and improve the way it conducts its business. He sees the use of digital twins—a virtual model designed to accurately reflect a physical object—as a key enabler for the future state the company is moving towards on its digital journey.
Working with Paul Clare, process engineering advisor for Hess, and a team from Kongsberg Digital, a dynamic digital twin of the company’s Stampede facility in the Gulf of Mexico was developed and implemented as part of a pilot project to enable process equipment condition monitoring on key topsides equipment.
The Stampede facility is located 115 miles south of Fourchon, Louisiana, in the Gulf of Mexico, and has a gross topsides processing capacity of 80,000 BOPD and 100,000 bbl of water-injection capacity per day.
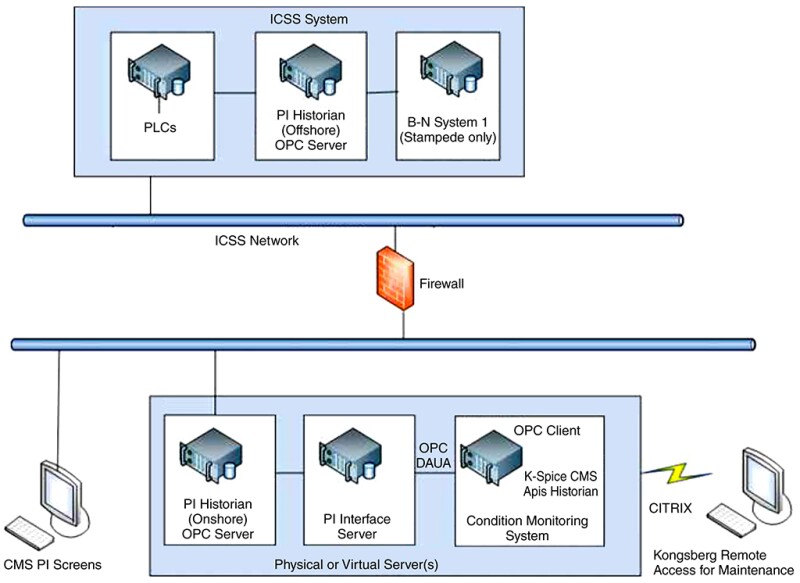
“We think, at a high level, that there is a lot of potential to improve the way we monitor, operate, and optimize our operations,” said Pertuso. “The way we select assets to conduct pilots on is a two-way street. We partner with teams that are open to working with us. Paul and the team were open to this project because they know what digital twins can do for them.”
Pertuso et al. noted in their presentation at the 2022 SPE Annual Technical Conference and Exhibition that the two existing Stampede multi-purpose dynamic simulation models were repurposed as a real-time performance monitoring model.
“The models are used for operator training, and are linked to the real control room system,” Clare explained. “We had a high confidence that these dynamic simulations were a pretty good representation of the actual plan that we’ve got now. The key thing on this digital twin is making this dynamic simulation in real time. It is receiving data from the field and constantly updating the model to reflect real-time conditions.”
Clare added that the beauty of a digital twin is that it can be used as a benchmark.
“If you’re looking at the pressure and temperature rates at your facility, you may question if they’re good or not. The digital twin offers that benchmark to see what it looks like, and if in real life, you’re not seeing these things, then there might be a problem to check on,” he said.
Condition monitoring is what Clare described as an ongoing process with both preventative and reactive maintenance needs.
“If something breaks, then we fix it. With preventative maintenance, if I change a filter every 12 months, for example, then statistically, I will have fewer breakdowns,” said Clare. “Where we want to get to is predictive maintenance, where all of the data from the field gives us a view of how healthy the equipment is. What we’re trying to do is predict a failure before it becomes too bad, so what we find are minor maintenance needs versus a complete changeout of a piece of equipment.”
Clare said that “everything done now is from the outside. We’re looking at the lube oil levels, checking temperatures, checking vibrations. The digital twin allows us to look inside the process and see how that pump or compressor is running in real time from a process basis.”
The pilot project implemented a data analytics methodology on a booster gas compressor (BGC) installed on the Stampede facility. Two years of historic data from the facility was used to estimate remaining useful life and detect anomalous operation conditions that result in damage to the system, eventually requiring a replacement or causing a shutdown, Pertuso wrote in SPE 210106.
The team tested the dynamic digital twin by going back in time and enabling the twin to consume process sensor data starting months before a known unplanned failure occurred. Then they evaluated how early they could have picked up signs of malfunctions through the twin and assess if something could have been done to avoid those issues.
The team was able to detect the anomalous operating conditions for the BGC about 6 days prior to a defect being detected by the maintenance crew on the discharge cooler, Pertuso said, adding that it is “possible to avoid damage to the gas compression system if we can detect when the BGC is being operated in an anomalous operating condition and prevent early replacement of expensive equipment.”
A goal of the project is to extend the real-time predictive maintenance and reliability effort across the entire company.
“Digital twins for us are a journey. We’re trying to create a system of engagement, to give our operation teams better tools, better situational awareness of how things are, and to make better decisions,” said Pertuso. “It will take time, with the other assets looking at this journey to learn and then start making their own mistakes, and not repeat the ones that we made.”
For Further Reading
SPE 112221 From Data Monitoring to Performance Monitoring by Michael Stundner, Schlumberger, et al.
SPE 181683 Deployment of a Generic Expert System to Rank Operations Business Opportunities Automatically Under Ever‑Changing Economic Conditions by Michael Stundner, myr:conn solutions GmbH, et al.
SPE 203022 MS Automated Well Portfolio Optimization for a Mature Hydrocarbon Field in the Middle East by Nagaraju Reddicharla, ADNOC Onshore, et al.
SPE 210106 Stampede Digital Twin: An Advanced Solution for Process Equipment Condition Monitoring by Dryonis Pertuso, Hess, et al.