

The propagation process and geometry of hydraulic fractures depend on complex interactions among the induced fractures and the pre-existing rock fabric, the heterogeneous rock properties, and the stress state. Accurate characterization of the resulting complex hydraulic-fracture geometry remains challenging. Fiber-optic-based distributed acoustic sensing (DAS) measurements have been used for monitoring hydraulic fracturing in adjacent treatment wells. DAS requires an optical fiber attached to the wellbore to transmit the laser energy into the reservoir. Each section of the fiber scatters a small portion of the laser energy back to a surface sensing unit, which uses interferometry techniques to determine strain changes along with the fiber. DAS data in offset wells fall in the low-frequency bands, which has been proven to be a powerful attribute for the characterization of the geometry of hydraulic fractures.
Numerous recently published field examples demonstrate the potential of low-frequency DAS (LF-DAS) data for the detailed characterization of the hydraulic fracture geometry. Understanding the fracture-induced rock deformation associated with LF-DAS signals would be beneficial for the better interpretation of real-time data. However, interpretation of LF-DAS measurement is challenging due to the complexity of the subsurface conditions, in addition to potential unanticipated completion issues such as perforation failure, stage isolation failure, etc. All current research efforts focus on the qualitative interpretation of field data.
In this study, we quantified the hydraulic fracture propagation process and described the fracture geometry by developing a geomechanical forward model and a Green’s function-based inversion model for the LF-DAS data interpretation, substantially enhancing the value of the LF-DAS data in the process. The work has a significant transformative potential, involving a tool package with developed forward and inversion models that can provide crucial insights for the optimization of hydraulic-fracturing treatments and reservoir development.
Methodology
The tool package can be used directly in the field to interpret LF-DAS data and monitor hydraulic fracture propagation. Raw data from the field measurement can be automatically processed. The geomechanics forward model we developed can quantify and analyze the strain-rate response from the LF-DAS measurements based on the 3D displacement discontinuity method. Fracture hits are detected by calculating three 1D features along the channel (location) axis, i.e., the maximum strain rate, the summation of strain rates, and the summation of strain-rate amplitudes. Channels with fracture hits usually exhibit significant peak values of these three features. We proposed general guidelines for fracture-hit detection based on the quantitative analysis of strain/strain-rate responses during the multistage fracturing treatment. The details of the forward model can be found in Liu et al. (SPE 202482, SPE 204457, ARMA-2020-1426).
Additionally, we developed a novel Green’s function-based inversion model to qualify fracture width and height based on the determined fracture hits. The strain field that is estimated from the integration of the strain rates measured by the LF-DAS data along the offset monitoring well is related to the fracture widths through a geomechanics Green’s function. The resulting linear system of equations is solved by the least-square method. Details can be found in Liu et al. (SPE 204158, SPE 205379, SPE 204225).
Field Application
The developed models were applied to an unconventional shale oil formation with two horizontal wells. The two wells are at the same depth and parallel to each other, separated by a distance of 1,300 ft. We analyzed the DAS fiber data recorded during the fracturing treatment of four consecutive stages named T1, T2, T3, and T4. At each stage, eight perforation clusters were stimulated simultaneously and the cluster spacing was about 22–23 ft. Stage T1, the closest to the toe of the well, was stimulated first, and Stage T4, the closest to the heel, was stimulated last. In the following discussion, we concentrate on the analysis of fracture hits and the fracture geometry associated with Stage T2.
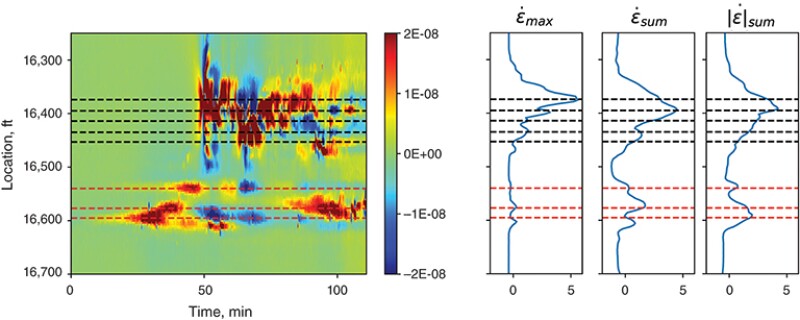
Detection of fracture hits. Fig. 1 shows the LF-DAS strain-rate data recorded at the offset monitoring well during the stimulation of Stage T2, as well as the corresponding three feature plots. The values of the three features were calculated using the data before the end of injection—indicated by the white dashed line in the waterfall plot of Fig. 1. The location axis is the measured depth along with the monitoring well. According to the guidelines based on the conclusions from the forward model, the fracture-hit locations are identified by the local peak values or deflections of the feature plots and are marked by the black dashed lines of Fig. 1. There are five such detected fracture hits in Stage T2. During the stimulation treatment of this stage, the fracturing fluid leaks into the previous stage (Stage T1) and reopens the three pre-existing fractures indicated by the red dashed lines. Based on the time of fracture hits and the hydraulic diffusivity of the fracture, the half-length of the fractures that encounter the monitoring well ranges from 1,370 to 1,870 ft at the end of injection.
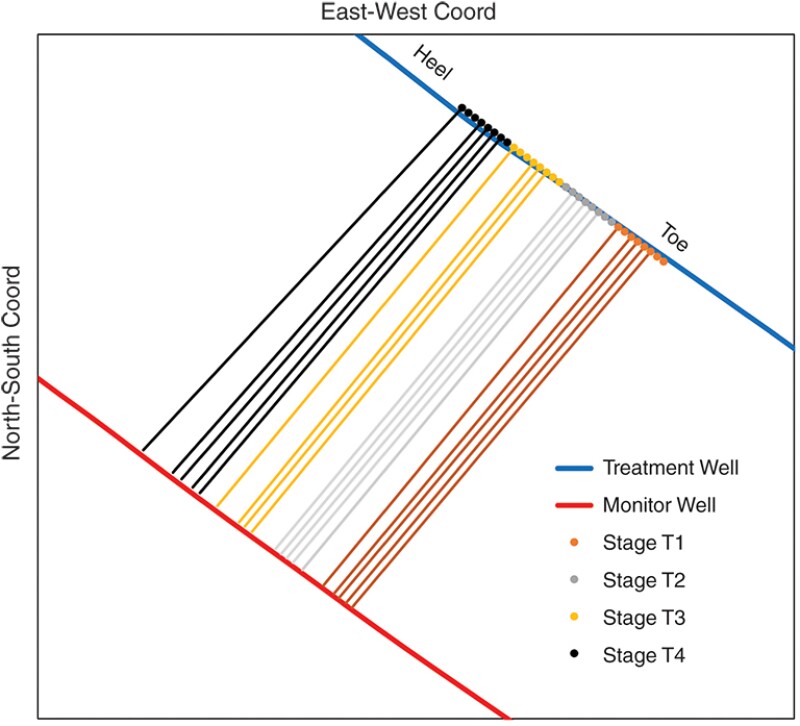
Fracture azimuth estimation. The locations of perforation clusters in the treatment well, the corresponding locations of the fracture hits in the offset monitoring well and their connections are shown in Fig. 2. The fracture propagation direction is between 229° and 233° from North and the azimuth of the well trajectory is 140° from North, indicating that the fractures are mainly planar and propagate nearly perpendicular to the wellbore in the formation. From the fracture-hit mapping in Fig. 2, it is worth noting that the fractures from the first two toe clusters in each stage usually cannot approach the monitoring well, which may be caused by stress-shadow effects associated with the previous stages.
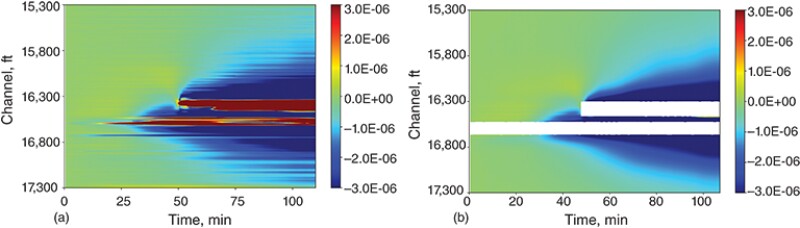
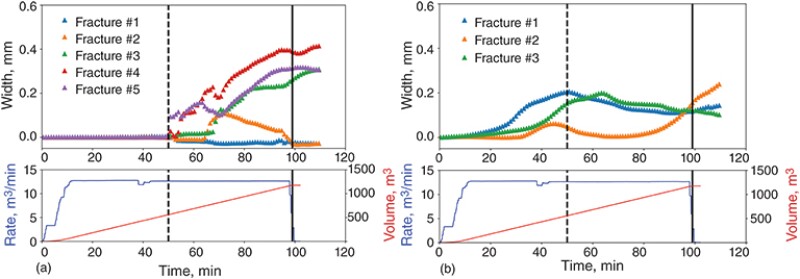
Fracture width calculation. The strain-rate data in Fig. 1 were integrated in time to obtain the strain data for the inversion model. Fig. 3 compares the field-measured (Fig. 3a) and the calculated strain (Fig. 3b) data based on the inversion model and shows a good agreement of the two data sets. It should be noted that strain data near the fractures were excluded from the inversion process because of their intrinsic measurement bias. Fig. 4 shows the fracture width at the monitoring well as a function of the treatment time for each fracture hit in the current stage (T2) and the previous stage (T1), as quantified by the associated time-variable fracturing treatment rate and volume. Fracture 1 is closest to the toe side and Fracture 5 is closest to the heel side. At the end of the fracturing fluid injection, the widths of Fractures 3, 4, and 5 in Stage T2 range from 0.2 to 0.4 mm; Fractures 1 and 2 initially open and then close during the treatment. Fractures in the previous stage (T1) reopen a maximum of 0.2 mm due to leakage of the fracturing fluid.
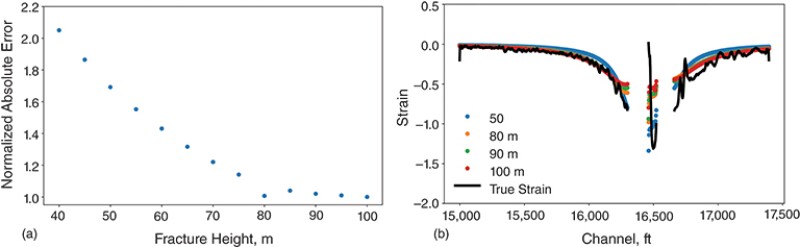
Fracture height estimation. We estimated the fracture height at the end of fluid injection by calculating the strain profiles associated with different fracture heights, ranging from 40 to 100 m (Fig. 5). Fig. 5a shows the average absolute errors between calculated and measured strains for different fracture heights, normalized by the minimum error. The results indicate that the error is minimized for a fracture height of 80 m. To visualize the differences, Fig. 5b compares the strain profiles calculated with different heights against the measured strains along with the monitoring well and shows that the strain profile for an 80-m height best matches the true strain profile.
Conclusion
A tool package including (a) a geomechanics forward model and (b) a Green’s function-based inversion model was developed to comprehensively interpret LF-DAS data, to elucidate the mechanisms of strain-rate responses, to identify fracture hits, and to characterize the complex geometries of fractures. The models were successfully applied to a field study in a shale-oil formation. The field study concluded that only four to five fractures out of eight designed clusters hit the monitoring well positioned at an offset distance of 1,300 ft. Our analysis results include (a) fracture widths near the monitoring well reaching 0.4 mm, (b) the aperture of reopening fractures reaching 0.2 mm, (c) impactful fracturing fluid leakage into the previous stage, (d) an average fracture height of approximately 80 m, and (e) half-lengths of fractures that encounter the monitoring well ranging from 1,370 to 1,870 ft.
For Further Reading
SPE 204158 Quantitative Hydraulic-Fracture Geometry Characterization with LF-DAS Strain Data: Numerical Analysis and Field Applicationsby Y. Liu, G. Jin, K. Wu, G. Moridis.
SPE 205379 Hydraulic-Fracture-Width Inversion Using Low-Frequency Distributed-Acoustic-Sensing Strain Data—Part II: Extension for Multifracture and Field Application by Y. Liu, G. Jin, K. Wu, G. Moridis. https://doi.org/10.2118/205379-PA
SPE 202482 Rock Deformation and Strain-Rate Characterization During Hydraulic Fracturing Treatments: Insights for Interpretation of LF-DAS Signals by Y. Liu, K. Wu, G. Jin, G. Moridis.
SPE 204225 Hydraulic-Fracture-Width Inversion Using Low-Frequency Distributed-Acoustic-Sensing Strain Data—Part I: Algorithm and Sensitivity Analysis by Y. Liu, G. Jin, K. Wu, G. Moridis.
SPE 204457 Fracture-Hit Detection Using LF-DAS Signals Measured during Multifracture Propagation in Unconventional Reservoirs by Y. Liu, K. Wu, G. Jin, G. Moridis et al.
ARMA-2020-1426 Hydraulic Fracture Modeling of Fracture-Induced Strain Variation Measured by Low-Frequency Distributed Acoustic Sensing (LF-DAS) Along Offset Wells by Y. Liu, K. Wu, G. Jin, G. Moridis.

Kan Wu is an assistant professor and Chevron Corporation faculty fellow at Texas A&M University. Wu has authored or coauthored more than 90 technical papers. She is an associate editor for SPE Reservoir Evaluation & Engineering and the Journal of Petroleum Science and Engineering. The research in her group includes hydraulic fracture modeling and optimization, multiscale and multiphysics modeling, and data interpretation and geomechanics modeling of distributed acoustic sensing. She holds a PhD in petroleum engineering from the University of Texas at Austin.

Yongzan Liu’s research interests include hydraulic fracture monitoring and characterization using fiber-optic sensing measurements, coupled hydraulic-thermal-mechanical modeling of fractured reservoirs, and enhanced oil recovery in unconventional reservoirs. An SPE member, he serves as a technical reviewer for a variety of journals including SPE Journal, Rock Mechanics and Rock Engineering, and Water Resources Research. He holds a PhD degree in petroleum engineering from Texas A&M University.

Ge Jin is assistant professor of geophysics and co-director of the Reservoir Characterization Project at the Colorado School of Mines. He is interested in distributed fiber-optic sensing and machine-learning applications in the oil industry, as well as seismic imaging and interpretation. Jin holds a PhD in geophysics from Columbia University and dual BS degrees in geophysics and computer science from Peking University.

George Moridis is a professor of petroleum engineering and holds the Robert L. Whiting Chair at Texas A&M University. He is a senior scientist/faculty associate at the Lawrence Berkeley National Laboratory, a visiting professor in the Guangzhou Center for Gas Hydrate Research of the Chinese Academy of Sciences, and an adjunct professor at both the Colorado School of Mines and the Middle East Technical University, Ankara, Turkey. Moridis has been an SPE Distinguished Lecturer and Distinguished Member and received the 2019 SPE John Franklin Carll Award.