
Good diagnostic testing is often painstaking, time-consuming, and costly, but recent studies suggest that a lack of knowledge can be even costlier.
According to several recent technical papers, hydraulic fracturing often misses its target, and productive early wells in stacked plays may be the template for development plans that leave a lot of hydrocarbons stranded.
Shell, Devon, and Anadarko have deployed multiple tools in the field because “no single fracture diagnostic can answer all the questions,” said Gustavo Ugueto, senior staff petrophysical engineer for Shell, during a presentation at the recent SPE Hydraulic Fracturing Technical Conference, where all these papers were presented.
The operators behind those papers combined data from multiple diagnostic tools to confirm potential problems that could significantly alter future production if not addressed.
Devon considered how best to develop stacked zones in the Meramec formation, in Oklahoma and found that efficient development required different approaches at different levels. The upper zone was geologically isolated and had to be developed separately. The two lower zones required a common development plan to ensure the area fractured could make contact with the productive rock from the top to the bottom on those zones.
To estimate the area effectively drained by a single well, Devon used an emerging technology, proppant treated so it could be electrically stimulated, making it possible to image the propped fractures likely to be the most productive.
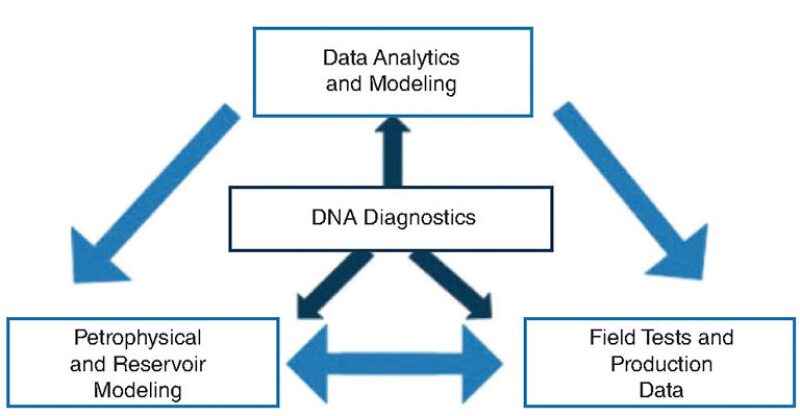
That was an indication of the appetite for new tools that can measure the unique DNA in well bacteria to map fluids in wells, or analyze what perforations are stimulated by measuring how much they erode. Anadarko is working with Biota Technology to use DNA sequencing to identify the many fluids found in and around its wells and then use those markers to understand the interconnections in its reservoirs.
“There is a lot to learn from our side, and hence our partnership with Biota has been critical,” said Jose Silva, Anadarko’s lead business strategist, advanced analytics and emerging technologies. “We’re trying to get better at it from a data science perspective, and we’re leveraging the understanding (of) all the databases that this particular company is building on its own.”
Companies asked EV Offshore to create automated systems to image and analyze the hundreds of perforations in hopes that the erosion caused by fracturing can tell them where the fluids and proppant are flowing.
Problems identified do not always come with solutions. Shell’s testing shows that nearly half the time when it is fracturing one stage, the fluid actually flowed outside the wellbore to other stages instead. While that work (SPE 189842) was based on a fracturing design not widely used in shale, known as single entry because it fractures one spot per stage, other diagnostic testing has shown the same problems for widely used plug and perf treatments.
“You should be bothered by this. It happens very frequently in plug and perf,” Ugueto told the audience of fracturing professionals at the conference. He pointed out there are some wells with no leaking stages and companies need to work together to solve a problem that is reducing the effectiveness of fracturing. “We need to get our heads together and figure it out. It is eating our lunch,” he said.
Hydraulic Fracturing Going Sideways
Stephen Rassenfoss, JPT Emerging Technology Senior Editor
Fracturing plans offer a vision of high-pressure slurries of water and sand shooting out of each perforation creating a dense, even array of fractures around a wellbore.
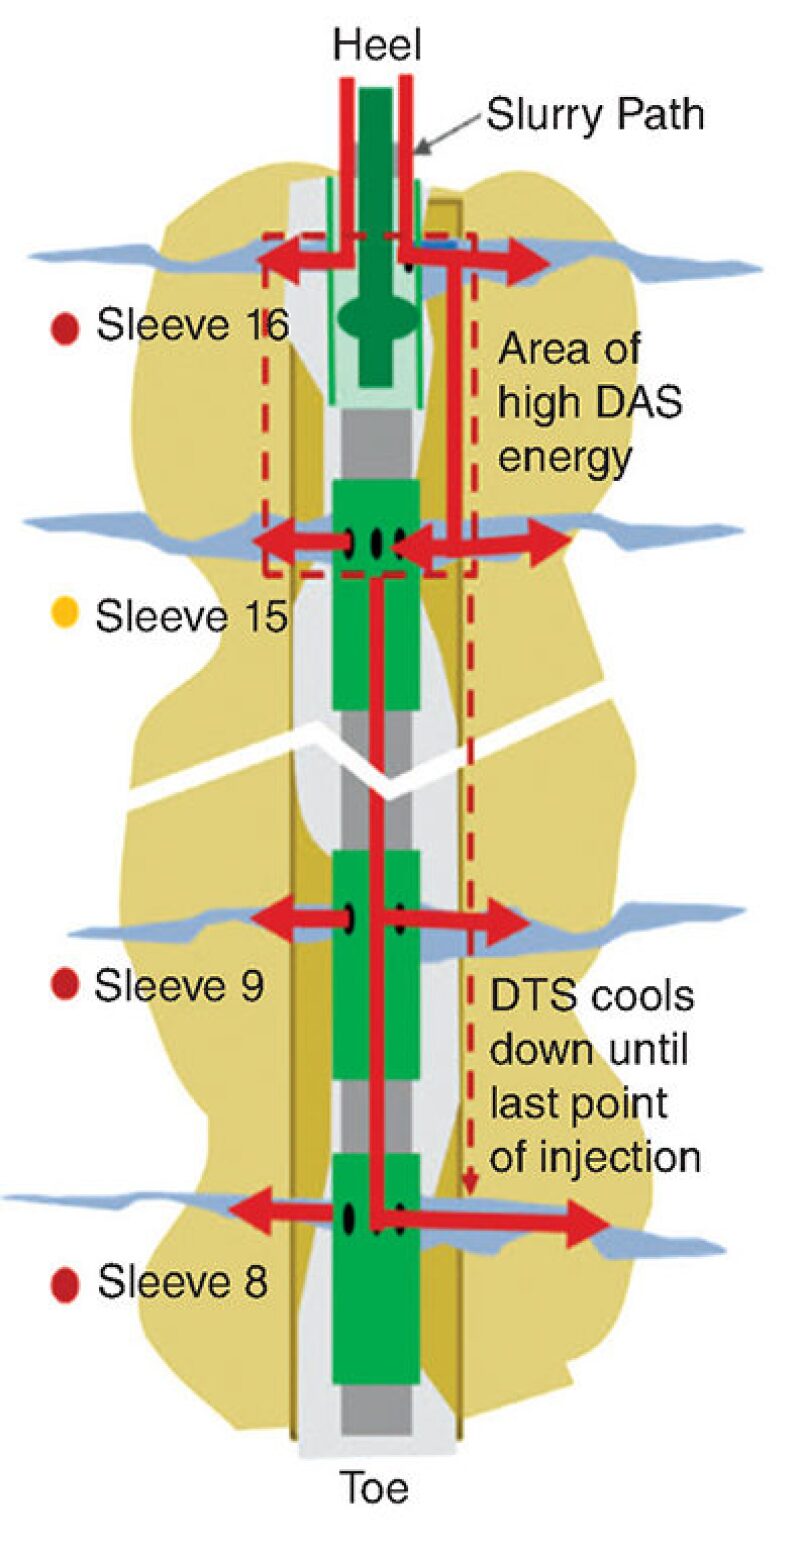
In reality, nearly half of the stages observed by Shell’s diagnostic tests started out with the fluid taking a sharp turn and heading down along the outside of the wellbore. Instead of shooting out through a sliding sleeve and fracturing the reservoir, the fluid flowed between the cement and the rock toward the end (toe) of the well, then jumped back into the casing further down the well before flowing out into a fracture.
An illustration showed how fluid injected in stages 15 and 16 traveled down to stages 8 and 9 (Fig. 1). That could leave one stage under-stimulated while feeding a super frac down the well growing far past the productive rock to where it could threaten other wells nearby.
Previous studies have shown that leaking is a problem. In 42% of the stages, the fluid escaped down the well toward the toe, while moving up the well (toward the heel) 6% of the time.
Pressure gauges and fiber optic cables tracked pressure and temperature changes caused by the injected fluid. Temperature changes show where the formation temperature is reduced by the cooler injected fluid, and the cables hearing the sounds of fracturing offer another indication of whether fluid is flowing. In some instances, the indications of leaking grew stronger over time, suggesting “progressive erosion of the cement behind the casing during the treatment.”
Multiple data streams provided a level of certainty about what is going on and filled gaps left by other sensors. “To understand well construction problems, no single fracturing diagnostic can answer all the questions,” Ugueto said.
Getting More out of Stacked Zones
Stephen Rassenfoss, JPT Emerging Technology Senior Editor
An early well that is a prolific producer can be a poor model for future drilling within a play with stacked zones. The potential downside is that strong early flow may be depleting multiple zones. Production from later wells drilled nearby is likely to suffer because the stimulated rock is in competition with older wells that have reduced both the oil and gas present, and the pressure needed for production.
Devon explained in a technical paper at the hydraulic fracturing conference (SPE 189835) how it used multiple diagnostic tests to analyze multiple zones in the Meramec formation within the STACK play in Oklahoma to maximize the ultimate recovery there.
Putting a horizontal well in each one of them would have been a bad investment because there was a good chance that the wells would be producing from overlapping areas. “It is rare you can develop one interval in a stacked play and effectively drain all of the hydrocarbon in place,” said Kyle Haustveit, a completions engineer for Devon Energy.
But the testing showed that is not always the case. The top layer did require a separate well because it was isolated from other zones. Haustveit presented a paper on how Devon used multiple tests to see if three stacked layers were connected, and then try to determine how best to drill and complete wells based on whether the zones communicate or not.
That required a significant investment in time and money—with two wells drilled and multiple diagnostic tests, including one using emerging technology. What was learned will be used to develop wells over a wide area of the formation.
“The properties are going for high dollar amounts we need to optimize” in development plans, he said, while presenting a paper on a testing program that sought to understand the interactions among three stacked zones.
To see if pressure in one zone affects another, Devon used dynamic fracture injection tests (DFITs). It measures whether small volumes of fluid injected into a formation at one location causes a measurable response elsewhere. In this case, it showed that a thin section of low-permeability rock was acting as a barrier between the top zone and the lower layers. Those tests also yielded information needed for fracture modeling.
When it was clear that production from one of the lower zones would draw from the other, the Devon team began trying to figure out what completion design was needed to develop fractures tall enough to efficiently drain the two-zone area. It went to great ends to check predictions of the fracture models, which incorporated DFITs estimates, core test results, and well logs (open hole quad combo). The Devon team wanted to be sure the fracture network created would likely reach the entire interval.
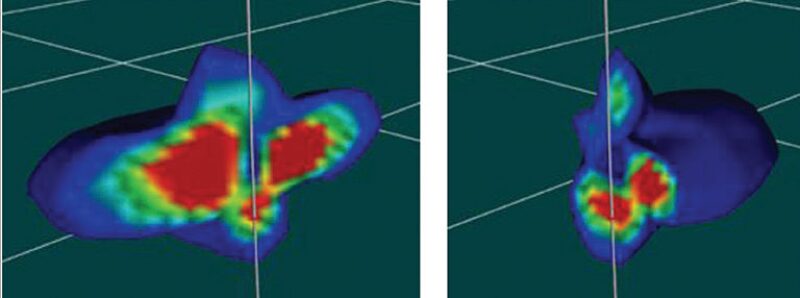
To verify the model’s predictions of fracture growth, Devon used both a proven technology during fracturing—injecting radioactive proppant tracer that could be observed while logging—plus a new one—electrically conductive proppant observed by surface sensor. The dimensions indicated by the radioactive particles were confirmed by the new technology from Carbo Ceramics, which also offered a 3D image showing the extent of the propped fractures.
Devon also equipped an offset vertical well with multiple downhole pressure gauges to evaluate how viscous the fracturing fluid needed to be to ensure the needed fracture height.
Seeking Insights in Microbes, DNA, and Rocks
Matt Zborowski, JPT Technology Writer
Anadarko Petroleum is building an expanding database of microbe DNA to help it map fluid movements and the source of production in the Delaware Basin.
Along with Biota Technology, which brings the genetic expertise, Anadarko is looking at adding biological data to the geological information used to make drilling and development decisions.
“About a year ago or so, the team at Biota [Technology] introduced us to the idea that DNA sequencing can be applied to oil and gas problems in not only rock samples from cuttings or cores but also over time through fluids produced from our wellbores,” said Jose Silva, Anadarko’s lead business strategist, advanced analytics and emerging technologies, while presenting a paper at the SPE Hydraulic Fracturing Conference (SPE 189846).
Since then, Anadarko has started a growing DNA data gathering program in the Delaware basins as it tries to figure out ways to use this bioinformatics data to improve how it manages drilling, completions, and production.
“We didn’t have an understanding of what microbial populations could do for us,” Silva said. However, “by the time we wrote the paper, we had already applied this technique of acquiring a new dataset on 33 wells in the Delaware Basin,” he said. “I can say that, at the moment, this is going to scale up all the way to around 200 wells.”
Samples of water, oil, and well cuttings were gathered by mud loggers and sent to Biota’s labs, where DNA was extracted and sequenced to produce thousands of reads per sample. The millions of columns of added data presented an IT challenge and an opportunity.
Anadarko is working on correlating changes in microbial populations to its geological information. “If these microbes live on fluids that are downhole, can we then find a way of correlating those with formations so that later on we can start asking more interesting questions around, ‘Where should I land my wells… and can I see those same microbial populations along those laterals?’” Silva asked.
“If we can grasp that, then I could try to affect the way I complete a well, and I could try to affect the way I’m spacing my wells. And if I could touch either of those two things or both together, those really quickly become billion-dollar opportunities for our company in the case of free cash flow,” he said.
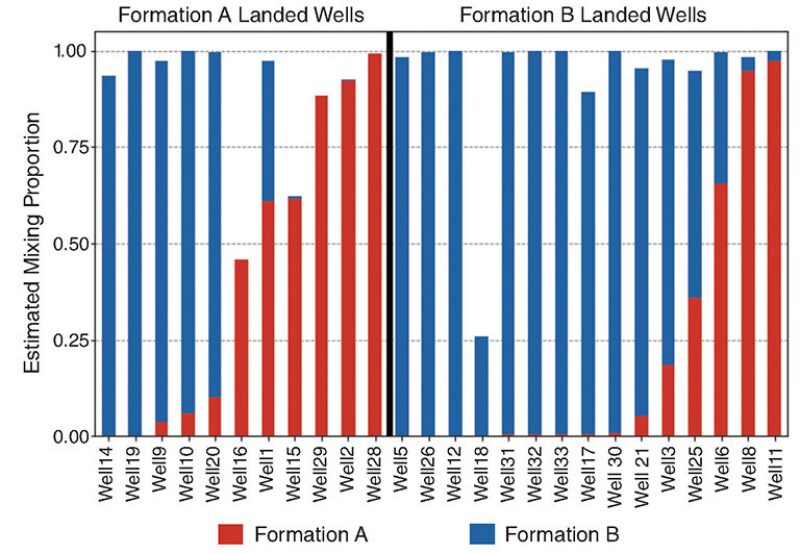
If the microbes in the fluids found in one well are found in another nearby in a different formation that could mean they are producing from the same rock. Samples of produced fluids were taken from 26 wells, with the team observing that some wells landed in one formation produced mainly from the other formation and vice versa.
“This is not a silver bullet,” Silva emphasized. “It’s about integrating this dataset with our petrophysical understanding of the field, our reservoir modeling capabilities, any other pieces of information that we have, plus all the data science components so that we can separate noise from signal.”
Going forward, Silva said Anadarko sees “a lot of value in continuing this program. So we are going all out definitely on one of our assets, and we are thinking that we should go ahead and start collection on other formations and other basins.”
Erosion as a Fracturing Indicator
Stephen Rassenfoss, JPT Emerging Technology Senior Editor
It is common knowledge that some perforations take much of the fluid and grow into large fractures while other openings along the well never grow at all.
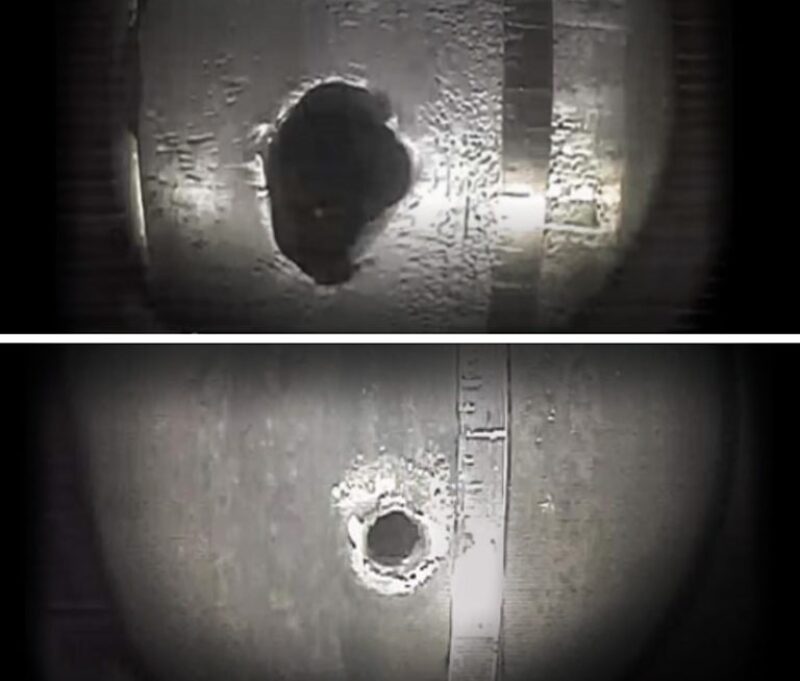
There is no way to image the path followed by the individual cracks created by hydraulic fracturing but it is possible to see where they start. The big ones likely grew from perforations where the grinding force of the high pressure slurries of water and sand injected for fracturing have turned carved, round holes into large, often-jagged openings.
Compared with methods such as microseismic imaging, this seems intuitive. More erosion means more sand and water was flowing in. If you see a big hole, that zone is stimulated, said Jeff Whittaker, a sales manager for EV Offshore, who delivered a paper on the work the company has done imaging and analyzing perforation erosion in unconventional formations (SPE 189851). As with other downhole diagnostics, the interpretation is more complicated, he said.
EV got into the business several years ago when shale operators asked if the company could adapt its tools to cost-effectively image, measure, and analyze the hundreds of perforations shot in shale wells.
Downhole imaging has been around for years. It has become more useful with digital equipment able to stand up to higher temperatures and pressures. The current maximums for EV is 2750 F and 15,000 psi, though high specification equipment is available.
The company’s high definition pictures show how rough-edged, round openings created by shaped charges can be quickly sand-blasted into smooth-edged, elongated shapes as much as 10 times the original volume, he said.
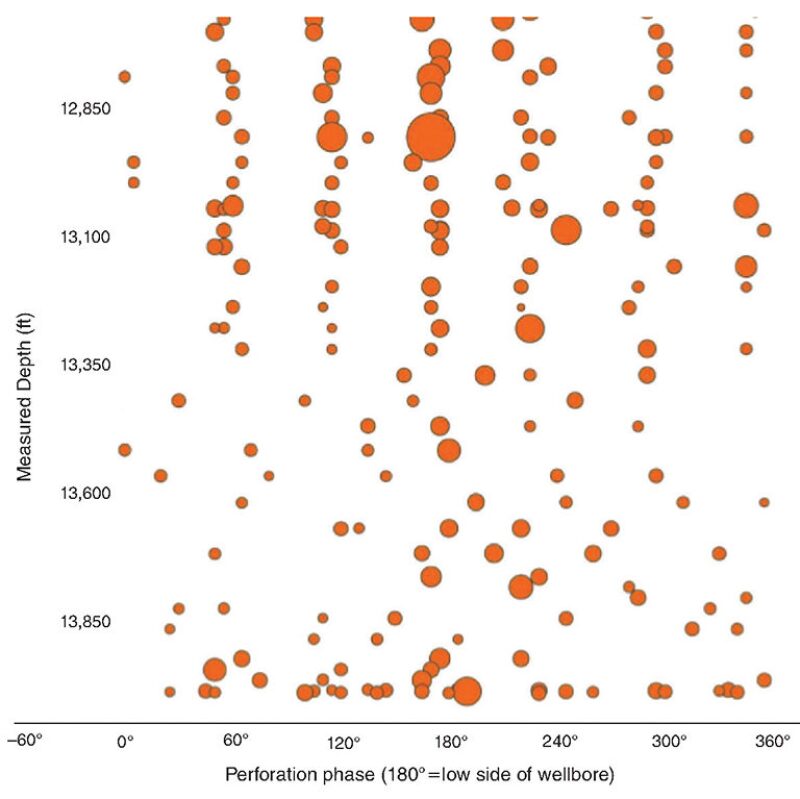
EV measures the dimensions and shape of each image, which is identified based on its location in the well and its position (phase) relative to the high side of hole.
The data confirms previous studies showing that in stages with multiple perforation clusters, the first cluster reached by the fluid in any stage is likely to grow the largest. More interestingly, the displays show there can be wide variations among the perforations within each cluster based on their position. Holes at the bottom of the well are more likely to grow significantly than ones at the top of the casing.
One explanation for why perforations at the bottom grow larger goes back to their creation. Perforation guns are run on coiled tubing strings which lie low in the casing. The shots pointed, which are right on top of the casing, create larger holes at the bottom than the shaped charges aimed at the top that travel further. Bigger holes are likely to take in more fluid, leading to greater erosion and greater potential fracture growth.
The paper covered a case study where the client imaged the perforations before and after fracturing. The before pictures are sometimes skipped because of the time required to do an imaging run, which adds to the cost. In those cases, the initial perforation hole size is typically based on surface tests, where the pipe specification and conditions often do not replicate what is in the well.
Erosion is a direct indicator of what has flowed out through the hole, but not necessarily a measure of future oil and gas flowing out of it.
“Operators are using this technology, in conjunction with other diagnostic data,” to evaluate how their perforation clusters are performing and how to do better, said Glyn Roberts, a technical specialist for EV who wrote the paper.
The service has grown significantly over the past year. “We are currently able to image about 240 perforations a day,” Whittaker said, “but EV is actively developing technology to significantly speed up the acquisition phase to optimize the process.”
Also Read
Digging Up New Information On What Fractures Really Look Like
They are not Drilling Shale Wells Like they Used To