
In recent years, Aker BP has explored and developed a number of digital improvements to optimize production. The underlying business drivers are meant to improve efficiency, increase production and reserves, decrease costs, and reduce the carbon footprint from operations.
The example described in this article has innovative elements of digitalization and automation of workflows which provide a new approach for better handling of slugging in subsea developments with long tiebacks. The new solution has a potential for optimizing production and limiting the amount of flaring.
Flow Instabilities in the Vilje Field
The Aker BP-operated Vilje field in the Norwegian Continental Shelf has occasionally experienced production-flow instabilities in the production pipelines and risers due to slugging. The company worked with Turbulent Flux to develop a software solution, the FLUX Stability Adviser, to continuously and precisely monitor production in real time.
Field Description and Outline of Problem
The Vilje field is a subsea development with three horizontal producers tied back to the Alvheim floating production, storage, and offloading (FPSO) facility through a production line longer than 20 km. The inlet separator at Alvheim is shared with other third-party developments. After an initial period of dry-oil production at the field, which started production in 2008, the oil rate has gradually decreased as a result of increased water cuts (WC) over time. Gas lift has been used to sustain production. The occasional slugging at the inlet separator had been controlled by increasing the backpressure to the production line and/or shutting in one of the producers. However, this practice affects production potential and may lead to production losses or deferral.
Explanation of the Solution
The two companies developed a Stability Adviser application to advise operators of the settings to optimize production in real time while lowering the risks related to slugging at any point in time.
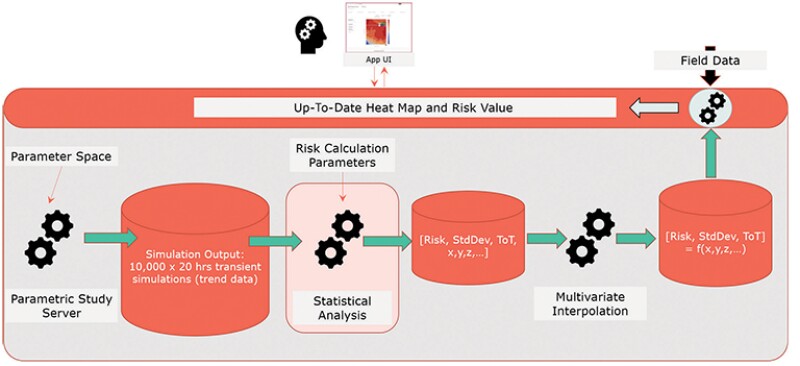
The developed solution runs on a cloud infrastructure with an interactive web-user interface. The main user interface contains a 3D heat map which is based on output from a series of pre-run transient simulations and a statistical analysis of the associated slugging severity. The model quality of the pre-run simulations was benchmarked with field data, and a similarity index was introduced to evaluate the degree of matching.
Transient multiphase flow simulations represent the state of the art in the prediction and analysis of slugging behavior in multiphase transport pipelines (both terrain-induced and hydrodynamic slugging). These simulators capture and follow slugs as they are forming along the pipeline. That said, these simulations are time consuming, which limits their usefulness in a real-time operational context.
To overcome this time constraint, a different approach had to be adopted. The solution was to combine transient-flow simulations with the development of a statistical measure of slugging severity. The measure has been designed to incorporate not only the variation of flow but also the magnitude of the mean flow, reflecting the fact that small variations in flow pose a greater risk when produced rates are high.
Data for the statistical analysis used to generate the heat map were obtained by precalculating a large set of parametric transient-flow simulations spanning the space of relevant operational conditions. The resulting slugging-severity parameter, presented to the user as the risk index, can be used to improve the situational, real-time awareness of field operations and to help identify the measures to reduce the risk of exceeding separator constraints, safely optimizing production.
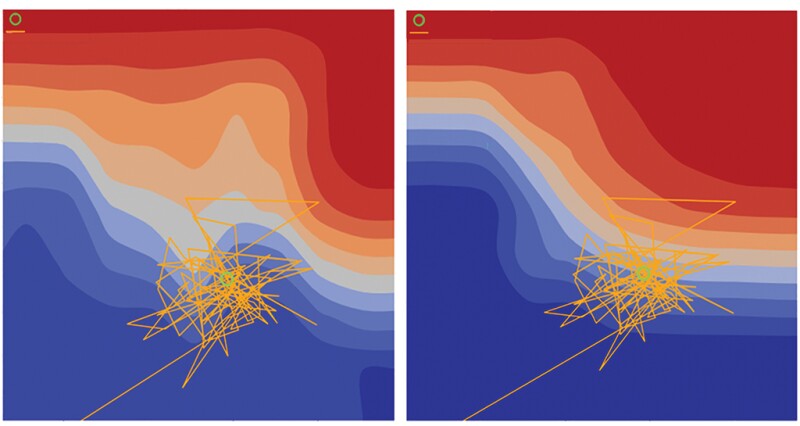
Finally, field data were overlayed in real time onto the heat map to let the operator assess the current risk level and the effect of changes in adjustments in control variables such as choke openings and gas-lift rates (Fig. 1).
Results
Even though the tool was piloted in the field for a couple of months with predominantly stable flow, the usefulness of the solution was observed in several situations. Two observations are shared.
Case 1—Shut-in scenario. Manifolds VI1 and VI2 tripped during de-isolation of the electric power unit when a subsea operation was underway to change out one of the electrical jumpers that provided power to the wells. This caused both wells to be shut in for 3 hours before being beaned back up to target rates. The long flowline and resetting of chemical dosage to the subsea system contributed to a couple of days of unstable production from the flowline.
The instabilities were evident on the subsea flowline pressure level, the gas rate on the topside multiphase flowmeter (MPFM), and the oil level in the first-stage separator. The flowline pressure was varying 2–3 bars at the most from the baseline to the peaks and valleys. The subsequent change was seen topside on the MPFM, where the gas rates were falling and increasing in the same time periods in which the changes in the flowline pressure were seen. Sudden changes in the gas rate could indicate more unstable flow, where gas and liquids are coming in slugs to the separator. The separator oil level was regulated at a setpoint of 77%.
After startup of the wells, the level saw a maximum peak at 95% (high alarm) with several incidents above high alarm, at the same time at which the pressure in the flowline and topside MPFM gas rate varied. High and low levels in the separator indicated that the production was coming in slugs, where the control valve out of the separator could not be regulated fast enough to maintain level around setpoint.
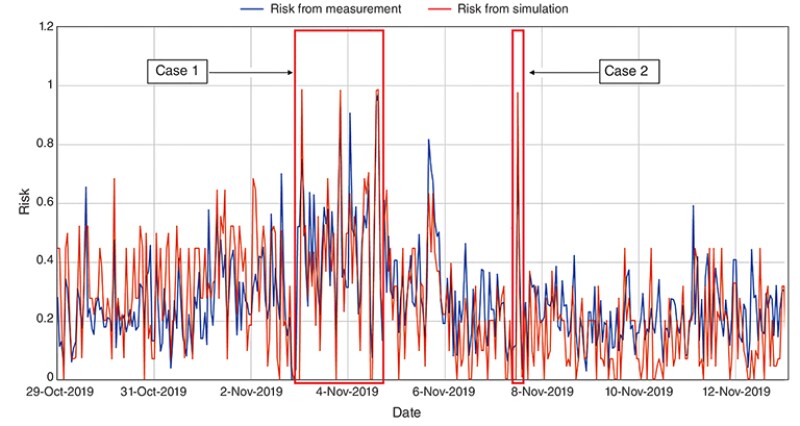
The instability and heightened risk of tripping was also evident through the developed risk index. Peaks in the risk index could be correlated to periods with changes in flowline pressure, MPFM gas rate, and oil level in the separator. The variation in WC trend and gas-lift rate trend was evidence of flow instability; the risk index was able to correctly assess the increased chance of overloading the separator in this period (Fig. 2).
From a usage point of view, the shut-in scenario gives confidence that the application and risk index can be used to gain situational awareness and provide some knowledge about the system response.
Case 2—Instabilities related to corrosion-inhibitor injection. Corrosion inhibitor was continuously injected subsea to mitigate corrosion of the flowline. Bottle tests of the chemical had shown that the corrosion inhibitor acts like an emulsifier, and changes in the flow signature had been observed when the dosage was changed or completely shut off. The flowline operated stably at several corrosion-inhibitor injection rates but generally became unstable just after a change was made. Dosage was changed for around half a day, which first led to the pressure building in the flowline subsea with 2 bars, before falling 2 bars relative to the pressure before and after. As in Case 1, topside MPFM gas rate and separator oil level fluctuated in the same period in which the flowline pressure varied, due to the gradual instability of the flowline. The oil level peaked at 92% (high alarm).
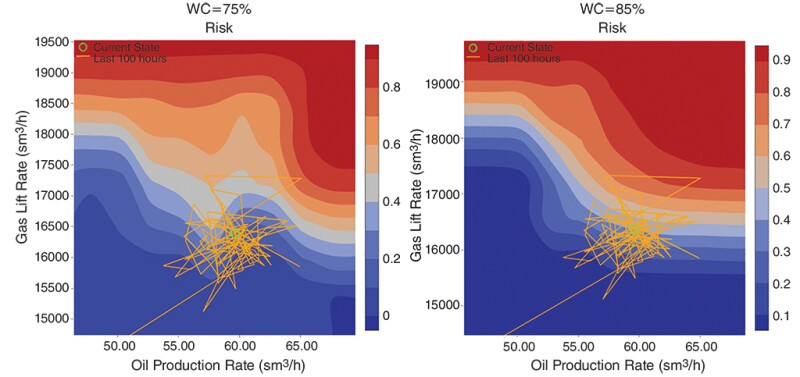
The risk index agrees with production data, where the risk spiked only in the same period in which the separator level reached its maximum. The peak of the risk index was correlated with a peak in WC when it appeared that a water slug reached the separator. The heat map added a predictive element to this situation where different scenarios could be evaluated, among them if an increase in WC would occur. In this case, the increase in WC shifts the higher-risk zones from top right to bottom left, predicting that the current operating setting would have a higher risk if the WC increased (Fig. 3). This scenario offered an indication of potential problems and provides the operator with an opportunity to prepare mitigating actions.
Conclusion
Both cases from the piloting period at Vilje provide confidence that the application can be used for real-time evaluation of the slugging severity in the field. More field trials are desired to continue to validate the criteria behind the severity index and to test alternative slug-severity formulations. We are currently working on an extension of the model to include a new field which produces through the Vilje pipeline and integrates the Stability Advisor with a network solver.

Andreas Burgos is principal advisor at Aker BP with specific focus on advanced downhole instrumentation solutions and production optimization through digital oil fields and integrated asset modeling. He previously held the position of chief petroleum engineer at Aker BP. Burgos has 31 years of experience in petroleum and reservoir engineering from within the E&P and service industries. He holds a master of science degree in petroleum technology from the Norwegian University of Science and Technology.

Lars Wollebæk is chief technology officer at Turbulent Flux and a recognized world expert in flow-simulation technology. He has held several key technology positions related to multiphase flow and numerical methods in companies such as SPT Group and Schlumberger. He was the former lead architect of the OLGA dynamic multiphase flow simulator. He holds a PhD in structural engineering from the Norwegian University of Science and Technology.