

COVID-19’s spreading has been well known since the first case was identified in Wuhan, China, in December 2019. Although several studies have explored its spread pattern and influencing factors, a relatively small number of studies have used agent-based modeling software to make predictions within fixed facilities.
This study focuses on using the agent-based Complexity and Organized Behaviour Within Environmental Bounds (COBWEB) modeling software to predict the spread of COVID-19 in offshore oil and gas platforms. It presents the results of the investigation on the effects of social distancing and the use of personal protective equipment (PPE) on the overall COVID-19 transmission within a typical platform offshore Nigeria.
Models were developed for both the sleeping quarters and the shared common areas and then used to simulate both “day” and “night” associated with workers’ schedules. The simulation results demonstrate that the model can be considered a useful, effective, and adaptable decision-making tool or what-if analysis tool in the fight against infectious diseases such as COVID-19.
Introduction
In living quarters of an offshore oil and gas platform, where people have close interactions and designated activity spaces, the COVID-19 transmission rate is assumed to be affected by both environmental and behavioral factors. The spread sometimes would differ from place to place because of environmental factors such as temperature, humidity, and air ventilation and because of behavioral factors such as close contact and proximity between people.
As we construct models that can represent the spread of COVID-19 in living quarters of a typical offshore oil and gas facility, we hypothesize that the COVID-19 infection rate also decreases with more social distancing measures taken within indoor settings. We also hypothesize that PPE use would alleviate the transmission rate of COVID-19.
Modeling Review
Three methods are most frequently used when developing infectious disease epidemiological models: mathematical, statistical, and machine-learning methods [specifically multilayer perceptron models (MLPs)]. The prediction accuracy of mathematical models is highly dependent on the characteristics of the data. Zeng et al. proposed three mathematical methods (sigmoid function, Gaussian function, and Poisson distribution) to predict the interprovincial transmission of COVID-19 in China. These models were not well-correlated with the real-life spread of COVID-19 because of the poor quality of the data. So, although mathematical/statistical models can represent the mechanisms of the spread of a disease, they may not be a robust or accurate COVID-19 prediction models.
On the other hand, machine-learning methods regulate their parameters to fit the models to existing data, so the effect of data uncertainty on prediction is lessened compared with mathematical models. Statistical models also have been compared to machine-learning models. Sujath et al. used a linear regression model and other machine-learning methods to forecast the spread of COVID-19 in India. The results of the linear regression were less accurate than the machine-learning methods. Moreover, in this study, the MLP model produced the best prediction. So, overall, machine-learning models are better at forecasting the spread of COVID-19 than purely mathematical or statistical models.
Chu et al. found that both social distancing and masks reduced transmission of COVID-19. Hence, a different modeling system is needed that considers public health intervention when modeling COVID-19 transmission. The COBWEB software can be used to develop such a model to simulate the spread of COVID-19. This is the modeling system that we used to answer our research question and to predict the effects of PPE use, self-isolation, and social distancing on the spread of COVID-19 in living quarters of a typical oil and gas facility in Nigeria.
Influencing Factors in COVID-19 Transmission
The independent factors that can influence the spread of COVID-19 can be categorized into meteorological or nonmeteorological variables, and both significantly affect the transmission rate of COVID-19. In this exercise, the focus was on the nonmeteorological variables. Nonmeteorological variables may be more influential than meteorological variables.
Despite the significant effect of nonmeteorological variables on disease spread, most studies focus on the effects of meteorological variables. COBWEB can be used to address this gap by including nonmeteorological variables, such as a person’s energy, vaccination status, social distancing, and PPE, representing different types of behaviors through using different agent types. If these independent variables are shown to be notably influential in decreasing COVID-19 transmission rates, then enforcing preventative measures such as social distancing and masks should be prioritized in policies to reduce infection rates.
Previous Oil and Gas Facility Simulation Setup and Results
At the 2021 SPE Nigeria Annual International Conference and Exhibition, Okafor and Bass presented results of the oil and gas facility model in a typical Niger Delta setting in Nigeria. The proposed model drew on the experience of building five different models of COVID-19 for other facilities other than oil and gas. The five models showed that it is possible to use COBWEB to simulate the spread and control of the virus in a densely populated space as well as in a fixed space, the effect of vaccination distribution, and emergence and effects of variants.
The first stage of model building for the fixed facility involved building a map of the oil and gas facility and populating it as would be expected at different times of the day (Fig. 1). Figs. 1a, b, and c show some results of model simulation of the spread of COVID-19 in typical residences of an offshore oil and gas facility. Eighty agents were used with a shared common area/dining hall and dormitory rooms. “Days” and “nights” were tracked separately to account for the different types of interaction between agents at different times. This was assumed to be a closed system with no new agents entering or existing agents leaving.
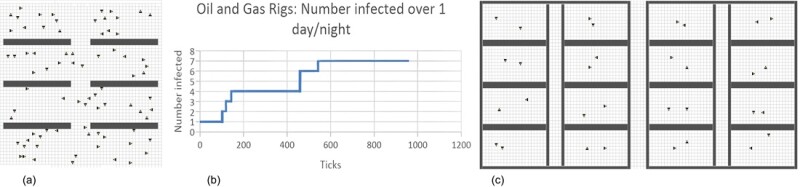
“Day” was represented by the map of the common room (Fig. 1a), and “night” was represented by the second and third floor models (Fig. 1c). The model was started with one diseased agent (not shown) in the “day” map representing the common area.
This was run for 420 ticks (COBWEB timesteps), representing 7 hours (Fig. 1a). The agents were then placed into the “night” map, representing the dorms within living quarters with five agents in each room. This was run for 540 timesteps representing 9 hours (Fig. 1c). The number of infected agents was based on the infections in the first “day” model. Each room was assigned a different type of agent to keep track of spread.
Random stones (barriers) also were used to simulate different levels of social distancing, self-isolation, and PPE use in the “day” model. Zero stones represents no distancing/PPE use. Five hundred stones represents minimal levels of social distancing plus PPE use, while 1,000 stones represents higher levels of social distancing plus PPE use. This feature was not used in the “night” model because social distancing and self-isolation is difficult to enforce in shared dorm rooms.
Differing numbers of infections based on the level of social distancing/PPE are seen in Fig. 1b, where higher levels of social distancing and PPE use resulted in a lower number of infected agents over the period of three “days” and “nights.”
For this exercise, we ran some more plausible scenarios of spread and then reran those scenarios with a mixture of variants. A subset of the scenarios was selected for further simulation with different virus variants, physical distancing, and PPE strategies. The results provide guidance for how the virus, including its variants, can be controlled once it is introduced into an oil and gas facility setting in Nigeria.
Methodology
An agent-based computer simulation model—COBWEB—was used in this work. COBWEB simulates the behavior of independent agents in the simulation, allowing for observation of emergent behaviors at both the individual level and the system level. It also provides a way to observe how a system adapts to variability and change over time. This flexibility allows COBWEB to be applied to a wide variety of systems, including the spread of infectious diseases. Various functions and elements can be used in COBWEB to simulate various situations and interactions. This includes agents, stones (barriers), resources, and waste. Stones can be used to create barriers such as buildings and objects in a 2D grid on which the agents interact. The model primarily focused on the agents and their interactions, particularly disease transmission. As such, nonessential elements such as the resources and waste functions were disabled. The exact settings used are omitted here for brevity.
However, we should note that COBWEB simulations are constructed by selecting values for different parameters through different tabs. The tabs used for this model were
- Environment to set the size of the common area for the “day” model and the size of the second floor
- Agent to set the energy levels of individual agents (to avoid premature death), prevent the birth of new agents, and the number of agent types (one type for each dormitory room)
- Disease to set the rate of infection and preventative effect of PPE
- Artificial intelligence to generate different genetic algorithms and, hence, populations for each type of agent but maintaining the same populations through different trials
The layout of each area was created through the manual arrangement of stones to create barriers (as illustrated in Fig. 1a). Specific details for each tab are omitted. Each timestep in the model (called ticks in COBWEB) was assumed to represent 1 minute in actual time based on observing several pilot runs of the model and the rate of spread.
Thirty-one agents were used to simulate the spread of COVID-19 within living quarters of a typical offshore oil and gas facility located in Nigeria. This included both the sleeping quarters and the shared common areas—two separate models for “day” and “night,” each with their own maps (Fig. 2 and 3).
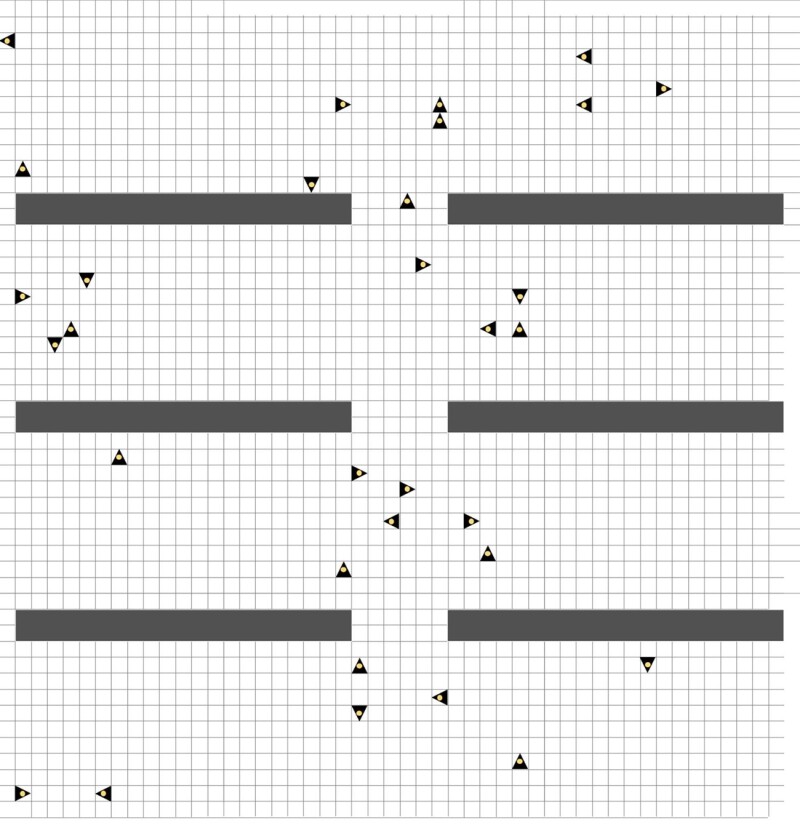
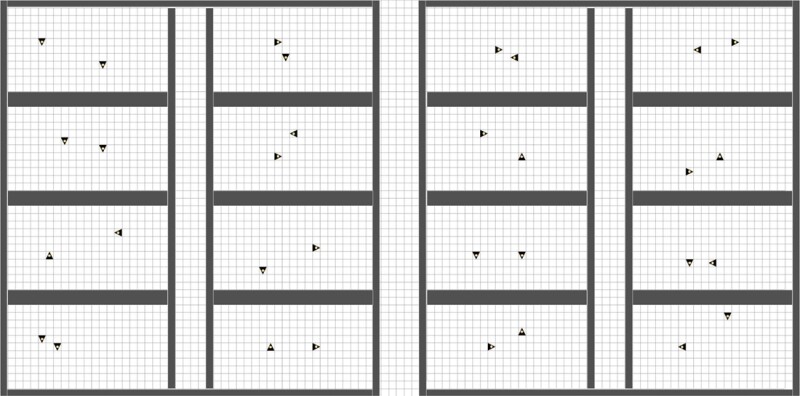
The common area included all the agents, and the dormitories (“night” model) was initiated with two agents in each room.
Typically, oil and gas facility workers work in 12-hour shifts. The remaining 12 hours spent in the living quarters were divided into 4 hours in the common area and 8 hours in the dormitories based on current recommended hours of sleep for adults.
Results and Discussion
The “day” model was run for 240 ticks (4 hours), and the “night” model was run for 480 ticks (8 hours). The agent numbers, stone maps, and work schedules were based on information provided by a group of engineers at the University of Port Harcourt in Nigeria. Three separate trials were run for 5 days and nights each: control, PPE, and social distancing. Each trial was initiated with a single infected agent in a randomly generated distribution of 31 agents in the day map. Both PPE and social distancing were only applied to the “day” map because PPE use and social distancing are difficult to enforce in shared dormitories.
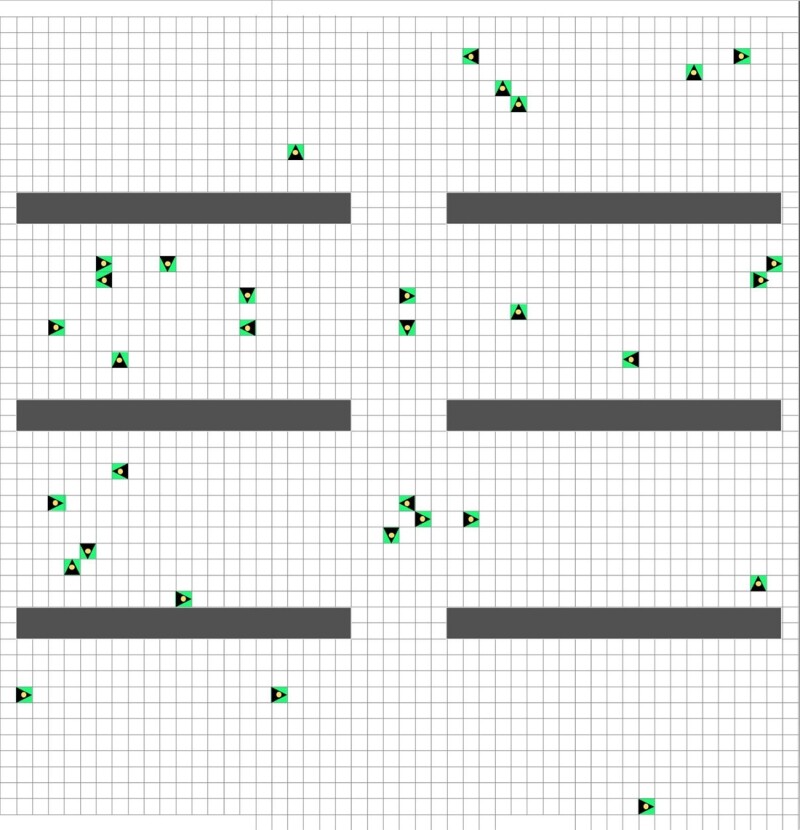
The PPE trial modeled the effects of wearing surgical masks. All agents wear PPE with 70% efficacy at the start of the trial, as shown by the bright green outline (Fig. 4). The social distancing trial (Fig. 5) used 1,000 randomly generated stones as barriers that agents cannot pass through to simulate the effect of any measure of social distancing. This setup could not discriminate between self-isolation or physical distancing. The number of stones mimicked the effect of physical distancing by taking up approximately 40% of the spaces allocated to the simulation. The agents in the social distancing trial were not vaccinated at the start.
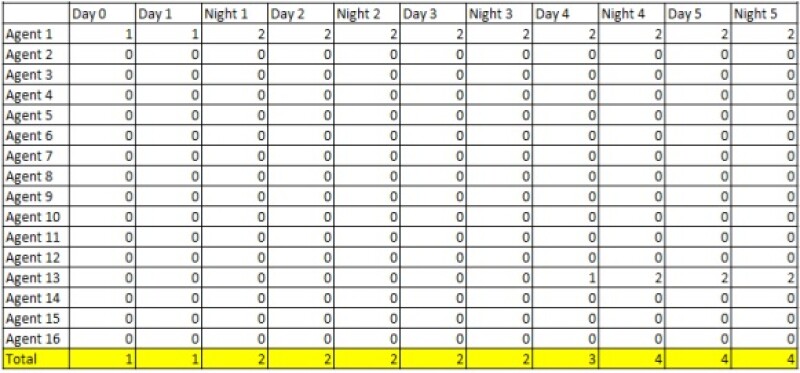
Results. In the control trial, one infected agent of Agent type 1 was placed into the “day” model as shown in Fig. 2 without any strategies to prevent the spread of the disease. The number of infected people were counted after each “day” and “night” (Table 1).
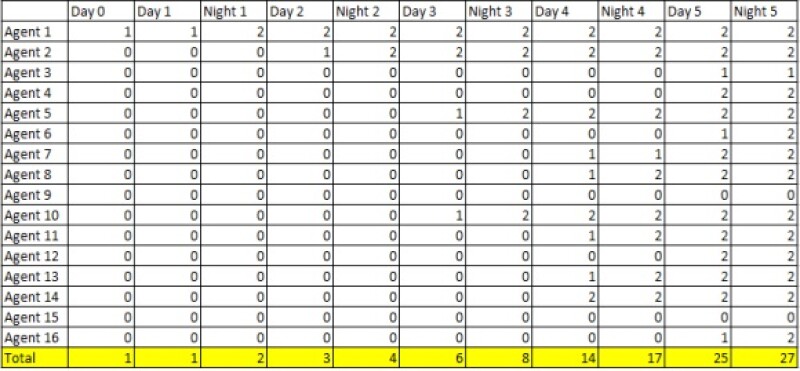
At first, the infected person did not meet and transmit the disease to other individuals on Day 1 after 240 ticks. When the infected person shared a room with another individual at “night,” both people were sick after 480 ticks. Then, these two infected people started to transmit the disease to others on the following “days” and “nights.”
Once an individual was infected with COVID-19 in the dorm room, then there was a high chance that both people in the room would be infected after 480 ticks because of the longer interaction time and the smaller shared area. Without any prevention strategies, the number of infected people increased dramatically. The disease spread widely to new agents during the “day,” and they brought the virus back to the dorm at “night.” After five “days” and “nights,” 27 out of 31 individuals, 84%, had been infected.
With the addition of 0.7 PPE effectiveness to the agents in the “day” model, the number of infected people in the PPE trial declined over five “days” (Table 2). Because the 0.7 PPE effectiveness was only used to represent wearing masks during the “day,” the simulations at “night” were similar to those in the control trial. After one person was infected in the room, both people in the room would likely be sick after 480 ticks. The disease was still spread during the “day,” but it was much slower with PPE.
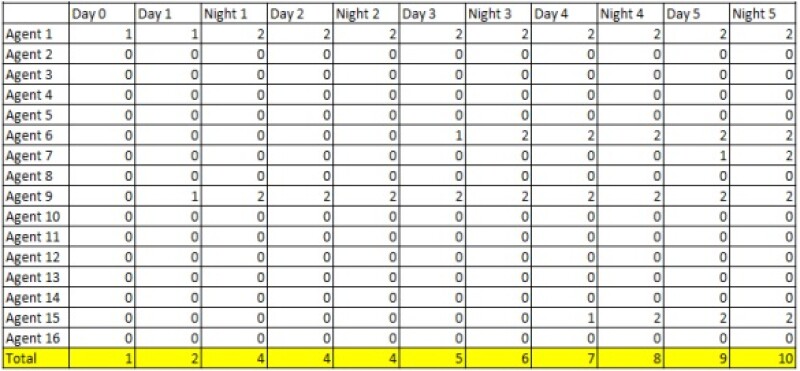
Overall, the number of infected people increased steadily, but only 10 out of 32 (31%) individuals were infected after 5 days and nights.
The total number of infected people with PPE over 5 days and nights was compared with the control group in Fig. 6. The red line represents the infected number of individuals in the PPE experiment, and the blue line represents the infected number in the control group without PPE. The red line has a higher infected number at first, but it was caused by the initial random distribution of agents in the model. Note that the infected agent (Agent type 1) met a new individual during Day 1 in the PPE model, while the infected agent did not have a chance to contact others in the control group. Thus, the higher infected number in the PPE model at the beginning does not suggest that PPE use leads to greater transmission.
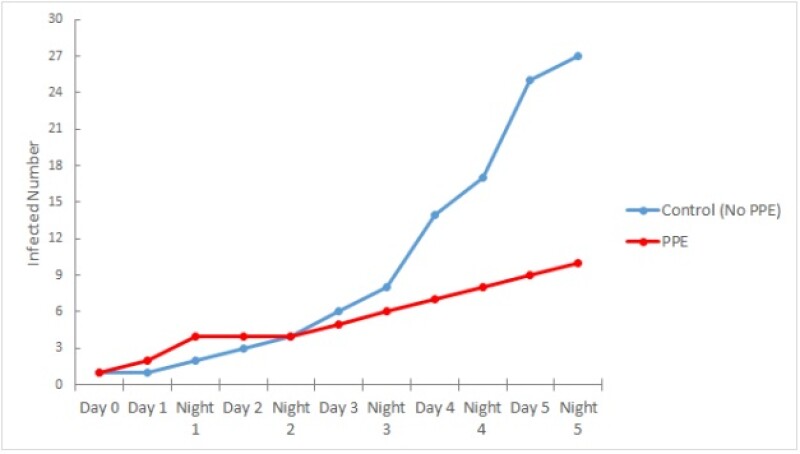
Overall, the infected number increased steadily in the following days and nights for the PPE trial, but it did not increase as quickly as the control group. This confirms that PPE usage does not prevent the transmission of disease but helps slow down the spread.
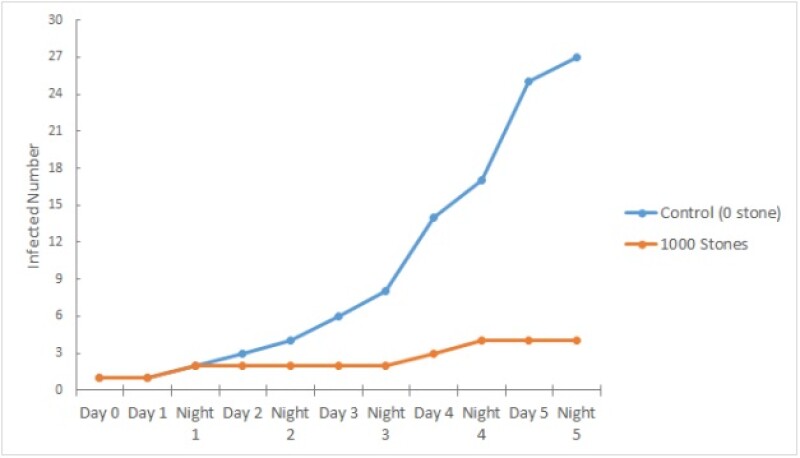
Table 3 shows the data from the social distancing trial with 1,000 randomly generated stones. It is noted that random stones were added only in the common area, and there were no modifications to the dormitories map. Thus, the results for the “night” simulation are similar to those of the previous experiments, and one infected person was likely to transmit the disease to a roommate. In the “day” simulation, however, agents were isolated by the stones, as shown in Fig. 5, and they had less chance to meet with each other. Thus, there was little change in the number of infected individuals.
Agents appeared less likely to move if there were too many stones around it in COBWEB because of energy loss from contact with stones. This issue may be a hidden reason for the decreased infected number as well. In the end, only four out of 31 agents (13%) of the individuals were infected in this trial.
The total infected number in the social distancing trial were compared with the control group (Fig. 7). The blue line represents the control group without random stones, and it is increased quadratically. The orange line represents the social distancing trial with 1,000 stones. The orange line is nearly flat compared with the blue line, which shows disease transmission is much slower in the social distancing model. This is a result of the random stones that prevent contact among individuals. Thus, our models indicate that physical distancing helps reduce the spread of the disease among a large group.
Discussion. As previously mentioned, the COVID-19 models examined the number of infected individuals under a range of situations such as mandated social distancing and basic PPE usage. In carrying out the simulations, it is evident that the data supports our hypothesis that the rate of infection among workers would decrease with social distancing and mask usage. The “day” model began with a single infected individual, but, as seen in Table 3, mandated social distancing aids in limiting that agent from direct contact with another agent.
With PPE usage. however, agents are free to come into close contact but may be resistant to infections because of the COBWEB PPE efficacy function. Analyzing the data further reveals several trends and implications, such as the difficulty in reducing the infections at night in shared accommodations.
Several key trends are clearly shown. In all three models, infections occur at a much slower rate in the common area compared with in the dormitories. In each of the three tables, any increase in infections, especially near the beginning of simulations, is generally higher for the “night” model because of its smaller shared rooms and longer operation time.
Once one person in the room was sick, there was a high chance that both people in the room would be infected after only one night. There are real-world explanations. In a typical facility, workers in dormitories would be in smaller quarters for an extended period and follow fewer preventative measures. This would allow for rapid transmission of disease from an infected individual. In fact, while social distancing and PPE usage is imposed in the common area, infections are limited but any agent occupying a room with the infected agent at night is much more likely to become infected. Over an extended period of time, a workplace may have many infected workers even with restrictions imposed.
On the other hand, the “night” simulations were the same in all three trials. No random stones and applied PPE were enforced in the dormitories. Thus, the differences in the total infected numbers were primarily a result of PPE usage and social distancing in the common area in the “day” model. The models account for the spread of COVID-19 only within the residence for 5 days and nights. The data in Table 2 and Table 3 reveals that social distancing or PPE usage can effectively suppress the outbreak. However, the trends in Figs. 6 and 7 are still rising, suggesting that these preventative measures alone are not long-term solutions.
Conducting this study not only allowed for a deeper understanding of the infection rates in a closed facility but also opened doors to future research. A possible next step is to examine the effects of vaccinations and COVID-19 variants. In countries such as Nigeria, the percentage of vaccinated citizens is continually rising, and this plays an important role in the epidemiology of the pandemic in Nigeria. An equally important factor is the rise of variants and their differences in transmission.
Incorporating both vaccinated workers and specific variants into the simulations would allow for in-depth analysis of virus spread. As well, future research might model the offshore work environment better. For instance, the simultaneous effect of social distancing as well as PPE usage on the infection rate can be examined in the common area with and without implementation in the dormitories.
Future models also can also include the different categories of workers because their varied shifts and working hours can influence virus introduction and circulation within the facility. Overall, these topics for future studies create a research plan that would go beyond the existing simulations to provide a more-precise picture of the dynamics of transmission.
Acknowledgments
The authors wish to express their special thanks to the following University of Toronto students who helped to build the new model used for the work presented here: Yuying Chen, Jessica Han, Xiaoxuan Han, Subshini Ramesh, Soumyadip Sarker, Jiya Shah, Joey Wang, and Jennifer Zhong. We also want to sincerely thank Cristiano Da Silva for revising the images for publication.