The distance between horizontal wells in the North American shale patch is almost always reported as a single measurement, often in clean round numbers, e.g. 450 ft or 600 ft. The problem with accepting such figures as the whole picture is that they are too simplistic, which can lead shale producers to make multimillion-dollar mistakes when it comes to drafting up the next drilling campaign.
This is the conclusion reached by Enverus (formerly Drilling Info), which says in a recently published report on well spacing that it has adopted a new method to determine the distance between horizontal wells and analyze the impact that distance has on production. The analytics and business intelligence firm points out that it had been using “simple” spacing calculations that it now considers to be “inaccurate.”
The tradtional method, used not just by Enverus but others across the shale sector, relies on a single parameter known as a midpoint measurement between wells. The new method presented by Enverus uses 300 different inputs to come up with a better answer.
“Well spacing is complex and incredibly important in today’s current free-cash-flow era,” said Sarp Ozkan, the energy analysis director at Enverus. In a press release he compared trying to understand the issue with “peeling back an onion.”
Some of the layers Enverus is using to better assess well spacing and its impact on production include taking into account that wellbore separation can vary all along the laterals. Horizontal distances represent the conventional way to look at well spacing, but Enverus says vertical separation must also be considered, which is especially relevant to stacked formations. When an operator’s directional drilling data is not available, the company is modeling “synthetic” well trajectories.
This enhanced analysis is all part of a well-spacing toolkit Enverus has rolled out in recent months. Its arrival comes as capital markets are hitting the brakes on funding the US shale sector due to disappointing well results and difficulties in establishing free cash flow.
As a result, many producers have pivoted their focus from production growth to drilling lower-cost wells that have stronger rates of return. However, this shift has not necessarily delivered all the answers on how far apart to drill infill wells to avoid fracture interference and excessive cross-well communication.
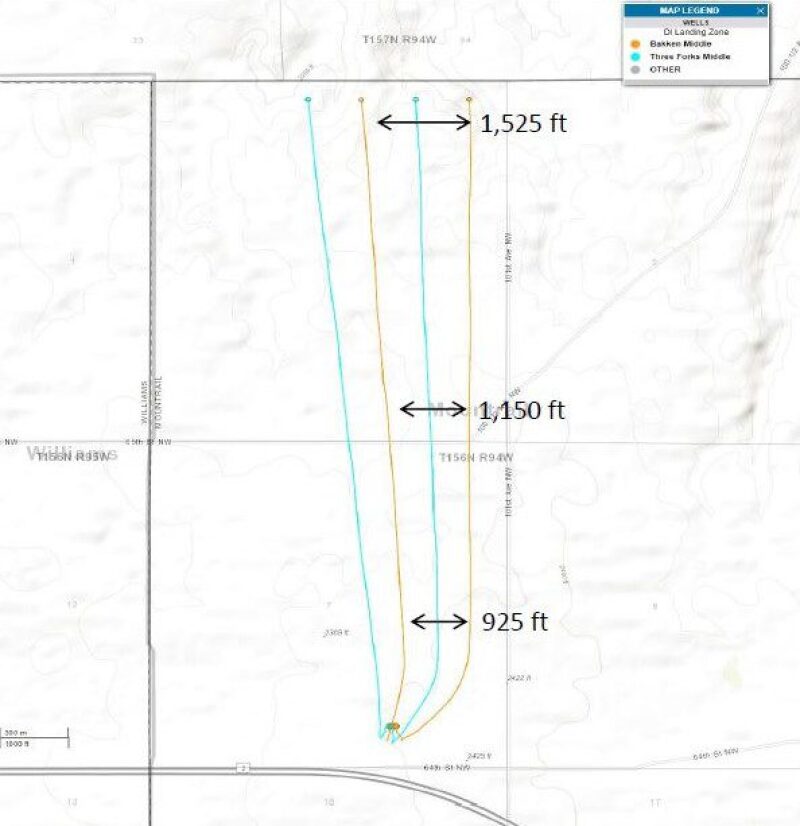
This graphic shows four wells in the Williston Basin: two in the Middle Bakken formation, and two in the Three Forks formation. For the Middle Bakken wells (yellow laterals) the midpoint spacing is 1,150 ft. A more complex analysis says the average spacing is in fact 1,333 ft. The midpoint approach overestimates minimum spacing by 19%, the average spacing by 16%, and the maximum spacing by 32%. Source: Enverus.
Midpoint Malaise
Enverus used several case studies in its report to show that misjudging optimal well spacing has led shale producers to over drill their assets. The result of landing just one or two unneeded wells is a severe downgrade in a drilling section’s net present value.
At least some of the issue is being attributed to using midpoints, which are defined as the distance between the middle of two or more lateral sections.
Enverus says this misleading metric has resulted in underestimates and overestimates of the true distance between producing wells. The report notes that one glaring aspect of this issue comes down to the fact that, “Wellbores aren’t straight lines.”
In a multiwell pad, you may have noticed that many wellheads are located several yards apart. Below the surface, they start to spread apart from each other. This means that a horizontal well’s heel section is usually closer to an offsetting wellbore than the midpoint. And the midpoint measurement can then be smaller than the distance of the well’s toe sections.
Using the Williston Basin’s Bakken Shale formation as an example, Enverus said that using only a midpoint measurement would lead to an averaged figure that is 10% lower than what it believes is a true spacing average for the play.
Enverus also highlights that such inaccurate spacing assumptions have “ripple effects across all parts of the industry.” To illustrate the point, the firm outlined the economic forecasting issues that arise when an operator’s expectations of well density fall short in the field. Such recalibrations are playing out in most major oil-rich shale basins in the US.
Using data from a select area in the Williston Basin, Enverus explained that when a 12-well drilling section instead becomes just a 10-well drilling section, it means the operator over-estimated the drilling section’s net present value by about $26 million, or 22%.
The knock-on effect of this scenario carries over to mineral rights owners who will see the real value of their royalties fall by about $15 million, or 10% of the original projection. Likewise, midstream operators may overestimate demand and miss out on $2 million in pipeline revenue. The service companies expecting to drill and complete those 12 wells will walk away from the project with $19 million less if the operator only executes on 10 wells.
Bigger Jobs, Lower Production
Finding the ideal development strategy is not just about well spacing. Enverus looked into other factors that show why this is a multivariate problem. One finding is that completion designs can exacerbate the issues stemming from tight spacing.
In Oklahoma’s STACK tight-oil play, the company presented a case study in which an operator stepped up from six wells to eight wells per section while also increasing proppant loading by 40%. The result was a 30% loss in productivity, according to Enverus, which added that the smaller program of six wells with less proppant was in fact the better combination.
The example provided some other insights into the so-called parent-child relationship that exists between neighboring wells of varying vintages. Enverus found that while parent wells (i.e., older pad wells) suffer some production degradation from infill activity, it is the newer child wells that suffer the most.
A look at child wells completed in 2017 and 2018 in the STACK show that they are about half as productive of their 2015 and 2016 parent wells. “Although the performance degradation of the basin may not be all because of well interference and parent-child issues, Enverus’s spacing analysis shows that it is clearly playing a role,” the report concluded.
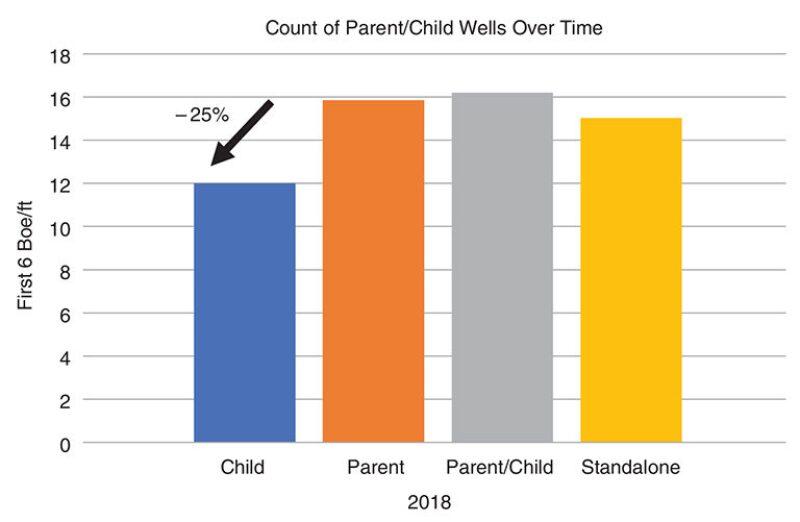
The number of child wells drilled in Oklahoma's SCOOP/STACK play over the past 2 years has increased by about five times compared with the number from 2016 to 2018. Those wells completed in 2018 have shown a 25% productivity decrease compared with parent well production. Source: Enverus.