
This paper presents results from full-scale testing of a flexible riser equipped with embedded sensors for distributed-temperature sensing (DTS). Testing includes monitoring of accessories mounted on the riser, monitoring of hot spots such as trenched sections of the riser, and detection of breaches of the outer sheath. Applications of such a condition-monitoring system to riser-integrity management (RIM) and production optimization are worth examining.
Introduction
With the increasing use of flexible-pipe technology—driven by the move of new offshore fields to deeper, more-marginal, and more-challenging conditions—the need for systematic management of the flexible pipes is becoming more apparent. In particular, the full implementation of RIM plays a vital role in ensuring an efficient and safe operation. Riser-condition monitoring and inspection form an important part of integrity management, together with processing and analysis of the monitored data. In that respect, the recently developed technology within optical-fiber monitoring offers unique possibilities for quantifying the integrity of flexible risers during their service life. The advantage of an embedded monitoring system is the ability to survey the riser condition continuously, thus enabling operators to detect potential damages in a timely fashion. The embedded system will allow monitoring in critical areas (e.g., under a bend stiffener or inside an I-tube) where access is limited for externally mounted monitoring systems.
Temperature-Monitoring System
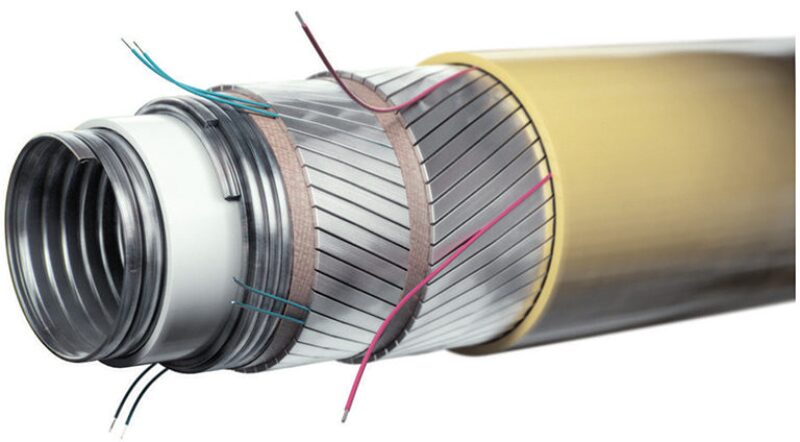
The temperature-monitoring system is a DTS system that uses a standard multi-mode optical fiber to measure the temperature at all points along the fiber with a given spatial resolution. The principle of implementation into a flexible pipe is shown in Fig. 1 above. The fiber is mounted on top of the outer tensile layer while being protected from crushing forces. The specific implementation that has been achieved allows for temperature measurements with a spatial resolution in the longitudinal direction of the pipe of approximately 8 cm. Currently, this can be implemented in pipes that are up to approximately 5 km in length, and the sample time can be as fast as 10 seconds per fiber. If a longer pipe length needs to be monitored, this can be achieved at the expense of spatial resolution or temperature resolution.
For the present series of tests, the fiber length is approximately 200 m, which allows for a high temperature resolution. The system measures every 10 seconds, with a temperature resolution of approximately 0.1°C and a spatial resolution of approximately 15 cm.
Test Setup
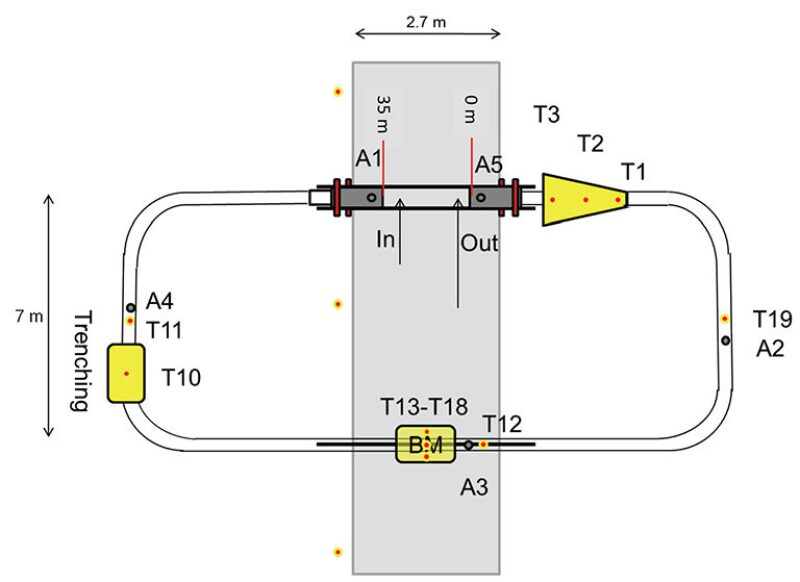
To test the temperature-monitoring system under a variety of conditions, a 35-m test pipe was produced. Several features were added to the pipe: a bend stiffener, a buoyancy module, and a 1.5-m section with added thermal insulation to simulate trenching. A schematic of the test setup is shown in Fig. 2. Points A1 through A5 are inlet points for water into the annulus, each having an internal cross section of approximately 1 cm2. Each of these points is connected with a thin hose to a pump to allow controlled injection of seawater into the annulus at a desired flow rate. The inlet points can be controlled individually so that different sections of the annulus can be flooded.
The most important parameter of the setup was the difference between bore and ambient temperature. The absolute temperatures are not important in most cases, because the temperature difference is what determines the size of any temperature event. Therefore, the following tests are all defined by the difference between bore and ambient temperature. The temperature difference was achieved by monitoring the temperature of the ambient seawater and then regulating the temperature of the bore fluid to achieve the desired temperature difference. The bore fluid was in constant flow throughout the tests to obtain a uniform bore temperature along the pipe. The temperature difference was checked before and during each test, and the difference never deviated by more than 0.5°C from the target value.
Results
The first test presented is a simple steady-state case in which a target temperature is maintained in the bore to test the stability of the heating and control system. It can be seen in Fig. 3 that the temperature is kept highly stable. The x-axis shows the time in hours since the start of test, and the y-axis shows the pipe position, along with a schematic of the test pipe. When the temperature was increased to 45°C, there was some slight oscillation in the temperature, but this was subsequently corrected in the control loop.
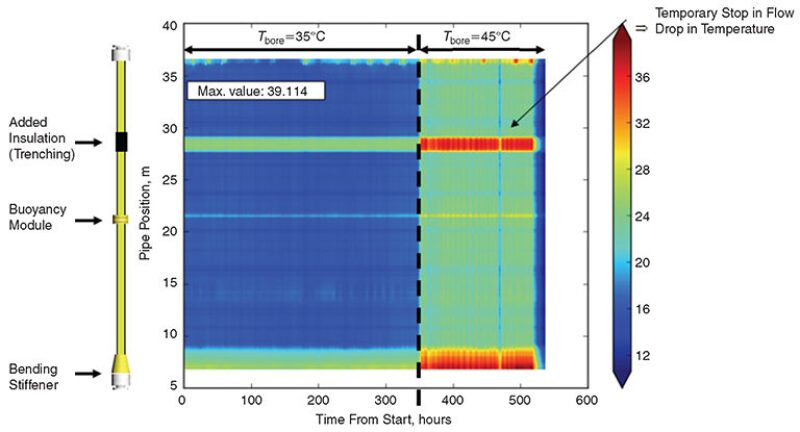
For a short time, the bore flow was stopped for maintenance (indicated with an arrow in Fig. 3); it can be seen that the DTS quickly picks up the drop in temperature, indicating that global pipe events such as shutdowns are easily visible to this system.
All features along the pipe are easily detectable because of the extra local thermal insulation they add to the pipe, including the bend stiffener, simulated trenching, and buoyancy module. The buoyancy module is approximately 1 m long but gives a clear signature because of the fine spatial resolution of the monitoring system. The temperature peak at the buoyancy module is approximately 5°C, with a difference of 35°C between the bore and ambient temperature. This means that all accessories along a pipe in operation can be tracked reliably and give a warning if, for instance, accessories are displaced during the lifetime of the pipe.
Trenching is even more apparent in the temperature profile. This means that events such as self-trenching and free spans can be detected very quickly and allow for a fast and accurate response to these events. Current standard practice is to perform remotely-operated-vehicle inspection of pipes once a year, which means that undesirable configurations can be present for months before detection and correction. By contrast, an optical-fiber temperature-sensing system will detect these developments while they happen, and automated software monitoring can alert the user in a variety of ways.
The next step in the test program was to simulate outer-sheath breaches under a variety of conditions to establish the signature of a breach and to determine the lower threshold of detection. Many more tests were performed than are shown in the paper, and the most-critical tests were performed several times to establish the statistical reliability of the system. For the sake of brevity, only some extreme cases are detailed in the paper.
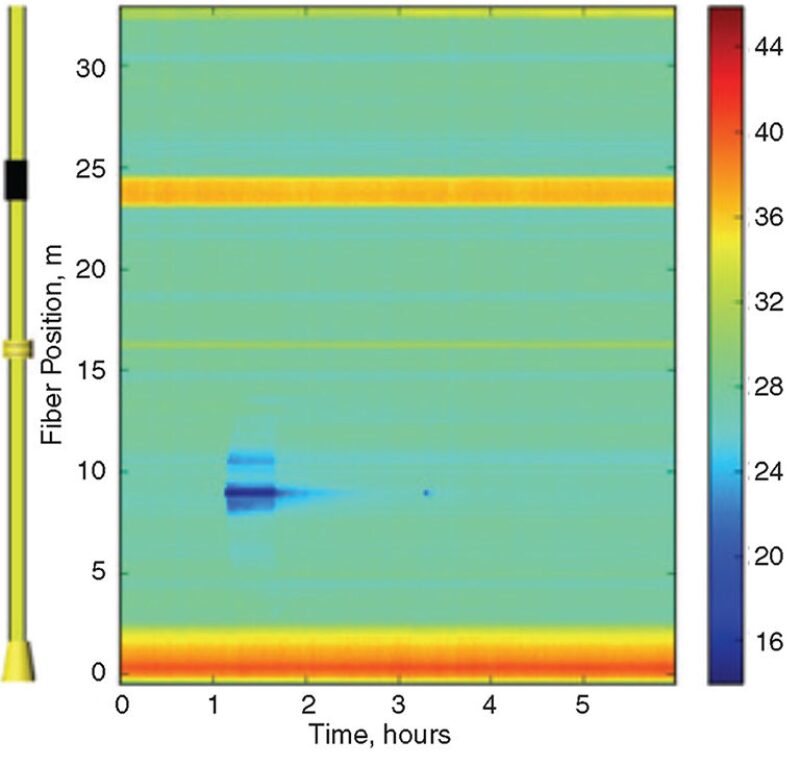
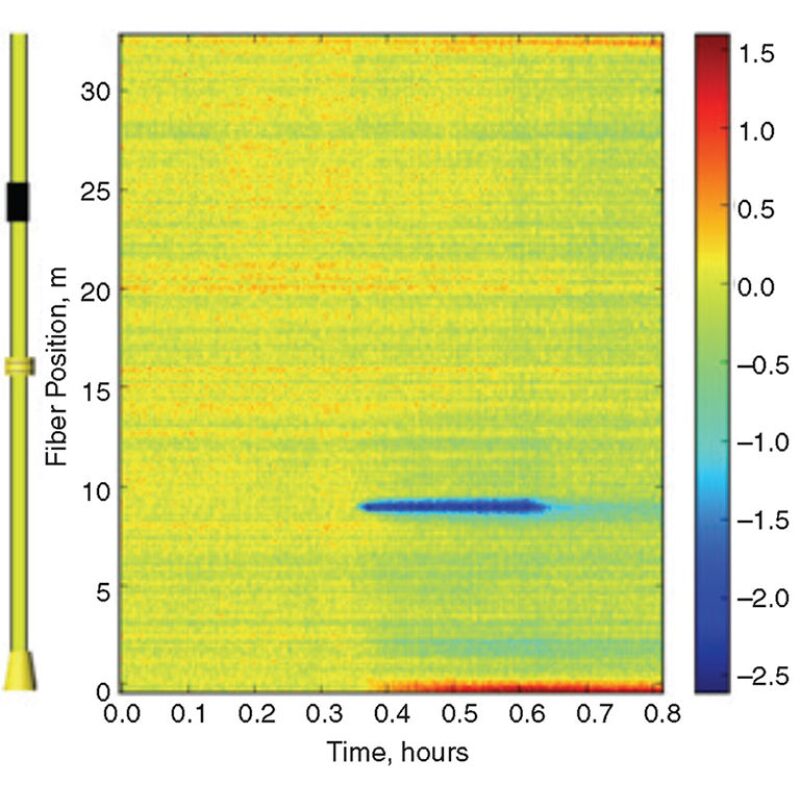
The first test was performed with a difference of 35°C between bore and ambient temperature to allow for easy detection and to establish the signature of a breach. The flow of the water injected into the annulus was 0.5 L/min, which is a small flow corresponding to a very small breach in the outer sheath. The signature of the breach is shown in Fig. 4. The breach occurred 1 hour after test start at 9 m from the inlet end of the pipe. The breach is clearly evident in the temperature data. It can also be observed that the ingress of water into the annulus results in cooling approximately 2 m away from the breach, because the water spread during the half-hour that water was pumped into the annulus. It is also interesting to notice the small dot in the temperature data at 3.3 hours and at a pipe length of 9 m. This temperature drop was caused by the ingress of the approximately 0.5 L of water in the connecting hose when it was disconnected at the top end. This is a very small volume of water at a very low pressure (approximately 0.2 bar), but it nonetheless shows up in the profile.
On the basis of the results of the first few tests, an event-detection algorithm has been developed to screen for temperature events, an automated data analysis that can be run on the temperature data and that will give an indication of anything unusual. If the value for a given timestep is greater than unity, it will be marked for closer inspection.
The final step of the test series (after many intermediate steps not covered in the paper) was to establish the lower limit of detection, to verify that the system would function under most operating conditions. This limit was set in cooperation with an operator, and the values were a temperature difference of 5°C and a flow rate of 0.5 L/min for 20 minutes. Owing to the test setup, the actual flow rate was 0.4 L/min. The results are shown in Fig. 5.
The breach is clearly visible with a temperature difference of approximately 2.5°C, very close to the analytical value for the difference between annulus and ambient temperature. It can be seen that the signature is much more localized but nevertheless clear.
The event strength for this breach peaks at a value of 2, which constitutes a valid detection. This test proves that auto-mated detection is possible, even for simulated breaches that are extremely weak, corresponding to a small breach near the top of the pipe (giving a low flow) and with a small difference between bore and ambient temperature.
Conclusion
The use of optical fibers providing full DTS throughout the risers allows various events to be monitored continuously. Results from full-scale testing show successful detection of outer-sheath breaches, including very small and weak -breaches. It has also been demonstrated that pipe states such as trenching are easily detectable. Accessories such as buoyancy modules can be tracked automatically with software monitoring during the pipe lifetime to alert the operator if these accessories move, which could potentially impact the configuration of the pipe.
Apart from the results presented here, the same temperature-monitoring system can also be used for a variety of other tasks such as monitoring of polymer-layer temperature to prevent overheating and monitoring of operational temperature along the entire length of the pipe to prevent hydrate formation in the bore.
Real-time riser monitoring improves decision making by allowing structural and temperature issues to be detected at the earliest possible stage and rectified in the most efficient manner, ensuring that the riser satisfies safety and regulatory requirements and helping to maximize oilfield productivity.
Contributions of this work to the technical knowledge base of the petroleum industry include the following:
- In-situ temperature measurements along the entire length of flexible risers
- Application of online temperature measurements to monitor the position of accessories such as clamps and buoyancy modules anywhere along the length of flexible risers
- Application of online temperature measurements to detect and locate a breach of the outer sheath anywhere along the length of flexible risers.
This article, written by JPT Technology Editor Chris Carpenter, contains highlights of paper OTC 23948, “Full-Scale Testing of Distributed-Temperature Sensing in Flexible Risers and Flowlines,” by Nick Weppenaar, Thomas Iversen, and Bo Andersen, NOV Flexibles, prepared for the 2013 Offshore Technology Conference, Houston, 6–9 May. The paper has not been peer reviewed. Copyright 2013 Offshore Technology Conference. Reproduced by permission.