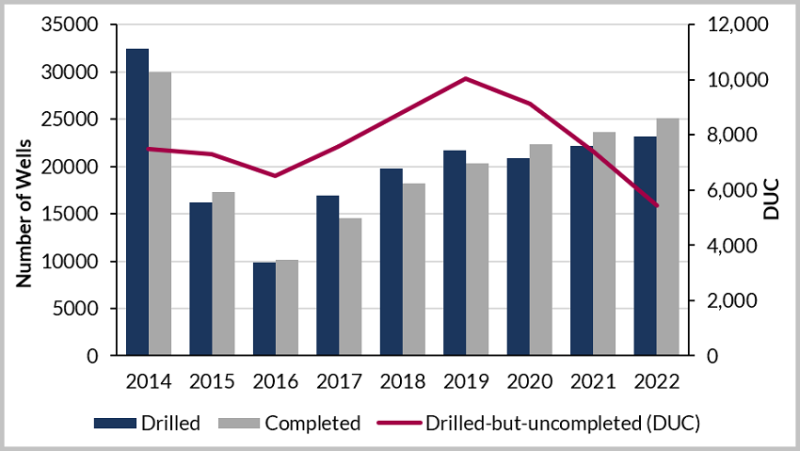
A new report estimates that amid strong production growth, the US shale sector is on a trajectory to drill and complete more than 20,000 wells this year. Released this month by Energent, Westwood Global Energy Group’s unconventional-focused research unit, the figure represents an 8% increase over 2018.
“If you look at it closer, by the end of 2019, you see that completions will start to outpace the drilling on a basin-by-basin level,” said James Jang, a data analyst and consultant with Energent, who added that the trend will also include a collective drive to whittle down the sector’s large inventory of drilled-but-uncompleted wells (DUCs).
If the projection holds, then it would mark the highest number of wells drilled since 2014 when US operators drilled almost 32,500 wells. It would also be the first time since the first half of 2016 that shale producers completed more wells than they drilled.
Energent expects the US rig count to drop in late 2019 as operators begin to aggressively target the DUCs, which should peak at about 10,300 wells in mid-year before being reduced to 4,600 in 2022. “The reason why you have seen the DUC count increasing over the past 3 years is because of the oil price factor,” said Jang. He explained that operators have been using the DUCs as “a kind of call option” as they waited for improved prices to maximize the economics of their developments.
Despite the turbulent period between October and December, prices have been relatively stable since then and may continue their modest rebound. Energent’s scenario for 20,000 new wells relies on a base WTI oil price of $60/bbl this year. If prices slip to $52/bbl, drilling activity will likely be disrupted and could stall, the report says.
The projected growth in drilling activity is already taking shape in the Eagle Ford Shale, the Williston Basin, and the Mid-Continent shale plays (i.e. the SCOOP/STACK). Drilling in the Eagle Ford increased by 43% year-over-year in 2018, while the Williston and Mid-Continent saw upticks of 36% and 23% respectively.
Activity levels in the Permian Basin have been more balanced ever since production overtook takeaway capacity last year. “That issue will be mostly solved by late 2019,” said Jang, as new oil and gas pipelines come on stream with combined capacities of 1.4 million B/D and 4 bcf/D.

Source: Energent, Westwood Global Energy Group.
Testing Technical and Economic Limits
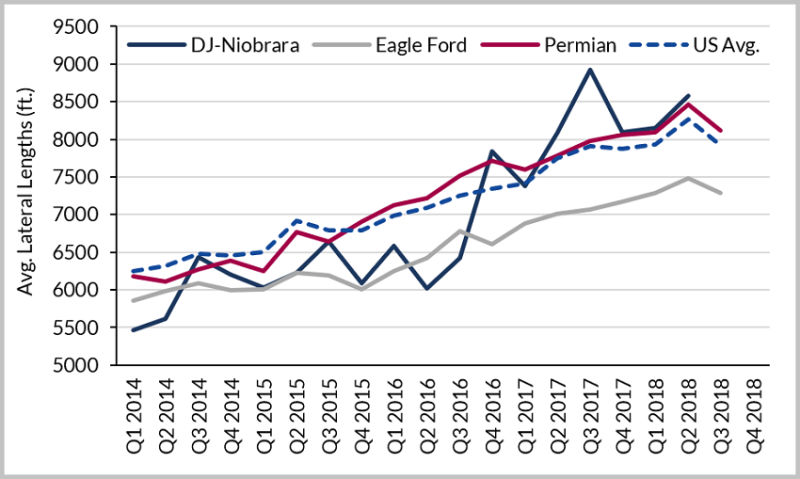
The analysis has also found that US shale producers may be approaching limits on horizontal well lengths and proppant loading. Average lateral lengths in the US only increased by 300 ft in 2018, or 4%, compared to the 8% increase of 560 ft. seen in 2017. Energent says the trend suggests that after years of increasing these key well design parameters operators are starting to come up against technical, acreage, and economic limits.
Well lengths in the DJ and Niobrara Basin saw the most notable change. In 2017, year-over-year growth was 21%, or 1,400 ft, compared to last year’s increase of only 3%, or 240 ft.
Proppant volumes are increasing, but the acceleration in tonnage per well is slowing too. The US total increased by 9%, or 530 tons per well in 2018 while in 2017 the same year-over-year figure was 27%, or 1,260 additional tons of proppant and sand.
The Permian lines up closely to the national average, showing a 2018 increase of 8% compared to a 26% increase in 2017. The sharpest drop off in proppant growth was seen in the Appalachia region, which includes the gas-rich Marcellus Shale. There, average proppant increases fell from an average of 41% in 2017 to only a 5% increase last year.

Source: Energent, Westwood Global Energy Group.


