

Production of paraffinic crude presents challenges due to depressurization and cooling of crude oil during production. These challenges include paraffin deposition on pipe walls due to the molecular diffusion process, increase in crude oil viscosity due to precipitated wax particles in bulk fluid, and gelling that may occur due to fluid-flow stoppage as a result of an unplanned shutdown. Only a small percentage of self-assembled paraffins is required to lock the solvent network (crude oil), e.g., 2% as estimated by differential scanning calorimetry (DSC) (Létoffé et al. 1995).
This paper focuses on yield stress (defined as the stress below which no flow occurs) for a waxy crude oil, to demonstrate/quantify how values are influenced by testing parameters. The study investigates the effect of crude oil subsampling, temperature of the crude sample, and cooling rate on the measured yield stress and performance of a pour-point depressant (PPD).
The deviations observed due to changes in test parameters cannot be overlooked when estimating the field performance of chemistry or during a predictive assessment of pipeline restart. Use of lab-measured yield-stress values directly as gel strength oversimplifies the complex phenomenon that occurs during pipeline restart. And, as demonstrated in this study, it may pose a risk due to the differences in yield-stress values obtained for identical crude oil samples as a function of selected test parameters. It is important to be aware of the influence of selected test parameters on lab-measured crude yield stress.
Experimental
A nonpressurized stock tank oil (STO) was collected from the field. Nonpressurized crude oil changes its composition over time due to the evaporation of lighter ends. This process, referred to as aging, affects the physical properties of the crude oil such as pour point and viscosity; this should be considered during laboratory evaluation and chemical selection. A stock tank oil sample collected from the pipeline/tank also exhibits shear and thermal memory effects that need to be removed prior to laboratory evaluation. This is typically achieved by heating and shaking the fluid sample above wax disappearance temperature (WDT). In this instance, the crude oil sample collected from the field was heated at 80°C for 16 hours to remove its memory and shear effects. The sample was shaken several times over a 30-minute period and subsampled into appropriate test samples of 30 ml to 100 ml. A portion of the crude oil was subsampled into 2 L glass bottles for later subsampling.
DSC was used to determine wax-appearance temperature (WAT) (60°C) and wax-dissolution temperature (73°C). To conduct yield-stress measurements, the crude samples were treated with 1000 ppm PPD (except for blanks) at a defined temperature and held at 80°C for 1 hour. Unless stated otherwise, the samples were then agitated to homogenize before pouring into the viscometer cup pre-heated at 80°C. In the rheometer, the samples were cooled from 80°C to 10°C at 2°C/min using a 1 s-1 shear rate. Low shear (~1s-1) is applied to mimic movement in crude during shutdown due to settling, thermal convection, or gel shrinkage. In the field, cooling rate is low and nonconstant, and depends on insulation, flow, etc.
The temperature was maintained at 10°C for 30 minutes to allow the sample to form a gel. The FL1000 van spindle was then rotated at 0.001 s-1, and the shear stress was measured as a function of time. The shear stress increased with time and reached a maximum before it started to decrease. This maximum value of the shear stress is considered as the yield stress of the studied gelled sample.
Results and Discussion
Effect of subsampling and crude aging on yield-stress values.
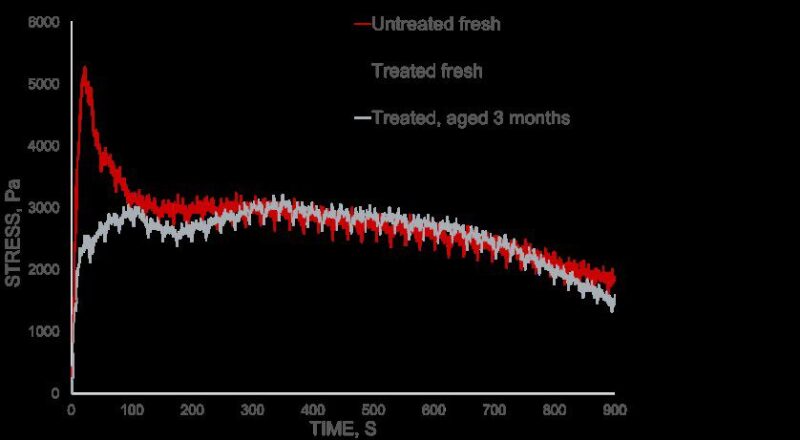
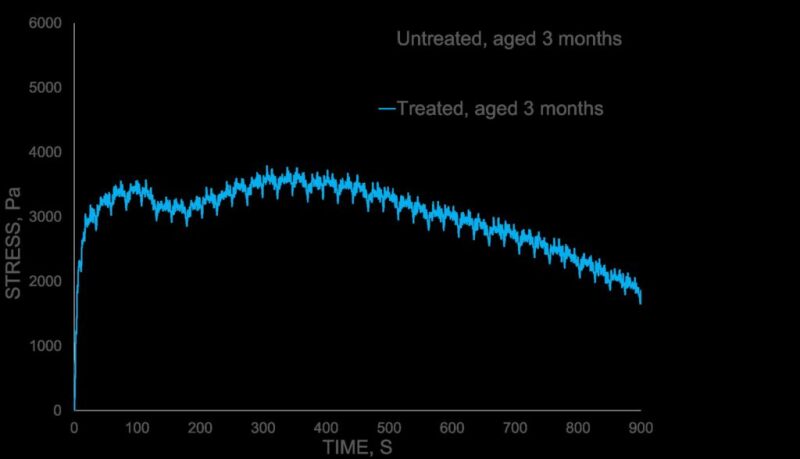
Fig. 1—Influence of crude-oil aging and subsampling on yield-stress measurements and PPD performance. Yield stress of crude after first subsampling (top) and second subsampling (bottom). |
Fig. 1 illustrates the influence of crude-oil aging and subsampling on measured yield-stress values. The results are summarized in Table 1. The influence of aging and multiple subsampling is not significant on the untreated oil; deviation between measured yield-stress values is 7.5% between “fresh” and 3-month-aged/twice-subsampled crude. (The experimental error of yield-stress measurement is calculated to be +/- 3%). While the 1000-ppm PPD-treated “fresh” oil exhibits yield-stress reduction of 56%, the same experiment, repeated 3 months later, measures a reduction in yield-stress of 49%. A more distinct impact on perceived PPD performance is observed for treated, twice subsampled crude; the yield-stress reduction is only 30%, a stark contrast to the 56% reduction originally measured. This can create bias in performance comparison over several months.
Sample | Aging | Subsampling [SS] | YS [Pa] | % Variation vs. Fresh 1st SS | % Reduction |
Untreated | fresh | 1st | 5265 |
| |
Untreated* | fresh | 1st | 5404 |
|
|
Untreated | 3 months | 2nd | 4937 | -7.5 | |
Treated, 1000 ppm | fresh | 1st | 2366 |
| 56 |
Treated, 1000 ppm | 3 months | 1st | 3206 | +35 | 49 |
Treated, 1000 ppm | 3 months | 2nd | 3783 | +58 | 30 |
Treated, 1000 ppm* | 3 months | 2nd | 3694 |
Table 1—Influence of crude-oil aging and multiple subsampling on measured yield-stress value and PPD performance. *Indicates duplicate measurements.
Effect of temperature of crude sample on yield-stress value.
To understand the effect of temperature on the yield stress of the crude oil, samples of crude were heated to 80°C (which is above WDT of 73°C), and PPD was injected at that temperature. In another test, the oil was heated to 80°C, and then cooled to 50°C. PPD was then injected to understand the impact of dosing temperature on gel strength. Results of this tests are indicated in Fig. 2 and Table 2.
Sample | Preheat Temp [°C] | Dosing Temp [°C] | Initial Test Temp, transfer to Rheometer [°C] | Test Temp [°C] | YS [Pa] | Reduction |
Untreated | 80 | 801 (shake) | 80 | 10 | 1826 | |
Treated, 1000 ppm | 80 | 80 (shake) | 80 | 10 | 942 | 48% |
Untreated | 80 | 501 (shake) | 50 | 10 | 393 |
|
Treated, 1000 ppm | 80 | 50 (shake) | 50 | 10 | 367 | 6% |
Treated, 1000 ppm* | 80 | 50 (shake) | 50 | 10 | 372 |
|
Table 2—Yield-stress values of untreated and treated crude sample with PPD dosage above or below the WAT (Létoffé et al. 1995). Untreated samples were agitated and lids were opened at dosing temperature to mimic volatile loss and shear; no PPD was added at dose temperature. *Indicates duplicate measurement.
In the first case, the untreated crude oil exhibited a stress value of 1826 Pa while the injection of the PPD reduced the yield stress by 48%. In the second case, the transfer of the untreated crude oil to the rheometer at 50°C resulted in significant disruption of the wax crystal network. As the oil cooled to 10°C, the gel network showed a considerably lower stress value of 393 Pa. Clearly, the difference in stress values could be attributed to the shear that was applied to the crude oil sample upon transfer to the rheometer cup at 50°C (below WAT). The shear resulted in a disruption of the wax crystal network which could affect the crystal size and shape. These crystals, upon further cooling, could not form a well-ordered crystal network, resulting in lower stress values. This phenomenon is also observed by Andrade et. al. in their study about the influence of initial temperature on yield stress, although the work does not link the initial temperature with the WAT of the tested oils (Andrade et al. 2015). Furthermore, the PPD introduced below the WAT under these conditions offered a negligible yield-stress reduction of only 6% relative to the blank.
Click image to enlarge.
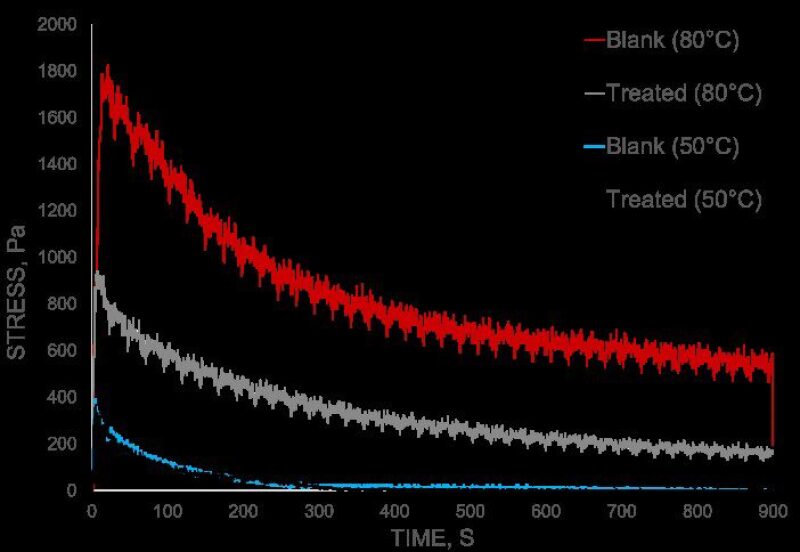
Fig. 2—Influence of dosing temperature above or below the WAT on yield-stress values and measured PPD performance. |
Cooling Rate
The cooling rate of the crude sample affects the ratio between nucleation-site creation and crystal growth. In the interest of screening a large number of chemical candidates, a cooling rate of 2°C/min is used, faster than typically encountered in the field. A rapid cooling rate will favor nucleation-site formation over crystal growth. With a slow cooling rate, 10°C/hr, crystal growth is favored. Systematic studies conducted by Andrade et al. on synthetic waxy crude (5% wax paraffin in mineral oil) confirmed that the higher the cooling rate, the smaller the crystal sizes and the more numerous the crystals (Andrade et al. 2018). The work revealed that gel strength (critical stress) exhibited a nonmonotonic response to cooling rate and summarized that the cooling rate that produces the highest number of crystal links yields the higher gel strength. Trends have shown that the relationship between yield stress value and cooling rate can change based on crude properties and the absence or application of shear during cooling (Guo et al. 2006).
Fig. 3 shows the influence of cooling rate and shutdown time on the measured yield-stress values; results are summarized in Table 3. The experimental design favoring rapid screening of PPD performance measured an untreated crude yield-stress value of 5450 Pa; the slow-cooling-rate method, on the same crude oil, measured a yield stress of 1820 Pa.
Sample | Cooling Rate, Shear upon Cooling, | Shutdown Time | YS [Pa] | % Reduction |
Untreated | 2°C/min, 1 s-1 | 30 min | 5450 | |
Treated, 1000 ppm | 2°C/min, 1 s-1 | 30 min | 2350 | 56 |
Untreated | 0.16 °C/min (10°C/h), 1 s-1 | 12 h | 1820 | |
Treated, 1000 ppm | 0.16 °C/min (10°C/h), 1 s-1 | 12 h | 930 | 49 |
Table 3—Influence of cooling rate and shutdown time on measured yield stress, when a 1s-1 shear rate is applied upon cooling.
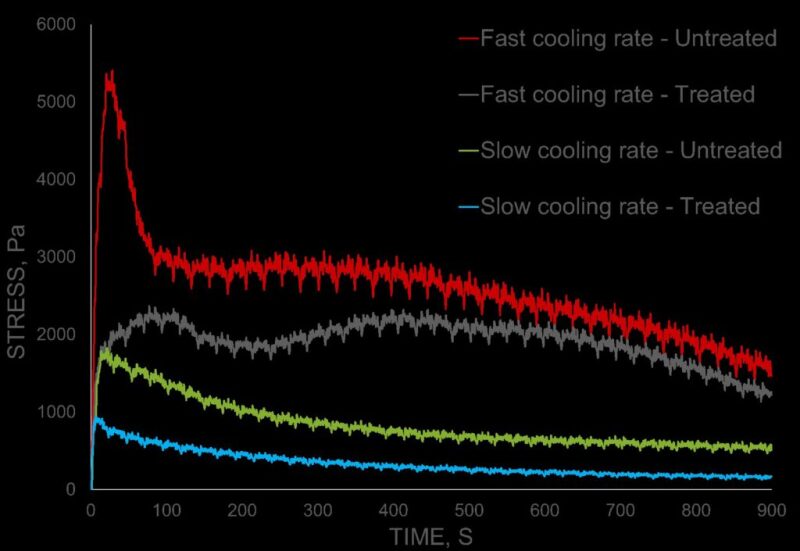
Fig. 3—Influence of cooling rate and shutdown time. Fast cooling rate: 2°C/min, 30-min static shutdown and slow cooling rate: 10°C/h, 12-h static shutdown.
Conclusions
- For comparative PPD performance evaluation, applying the same testing protocol on the same oil subsample and within a short time frame (a few days apart) is desirable. Crude-oil aging can have a potential impact on performance of pour-point depressant.
- Testing temperature and crude-oil preconditioning have a significant effect of yield-stress value of crude.
- During dynamic cooling, the gel strength of the crude oil is higher at a higher cooling rate due to reduced shearing time. At a slower cooling rate the gel strength is considerably lower due to increased shear time of the gel.
- For a predictive assessment of a pipeline restart, use caution when considering measured yield-stress values as inherent gel strength of the crude to estimate the pressure required to break a gel in a well or flowline. Models using advanced computational pressure-wave modeling, defined-measuring protocol, and consideration for gel degradation after the maximum stress can construct a more predictive assessment of the pipeline. These additional measures provide more reliable, though conservative, (Skjæraasen et al. 2015; Paso 2014) restart prediction.
References
- Létoffé, J. M.; Claudy, P.; Kok, M. V. et al. 1995. Crude Oils: Characterization of Waxes Precipitated on Cooling by D.S.C. and Thermomicroscopy. Fuel 74 (6): 810–817. https://doi.org/10.1016/0016-2361(94)00006-D.
- Andrade, D. E .V.; da Cruz, A. C. B.; Franco, A. T. et al. 2015. Influence of the Initial Cooling Temperature on the Gelation and Yield Stress of Waxy Crude Oils. Rheol Acta 54: 149–157. https://doi.org/10.1007/s00397-014-0812-0.
- Andrade, D. E. V.; Neto, Marcelino, M. A.; and Negrão, C. O. R. 2018. Non-Monotonic Response of Waxy Oil Gel Strength to Cooling Rate. Rheol Acta 57: 673–680. https://doi.org/10.1007/s00397-018-1108-6.
- Guo, Xuhong; Pethica, Brian A.; Huang, John S.; Adamson, Douglas H., and Prud’homme, Robert K. 2006. Effect of Cooling Rate on Crystallization of Model Waxy Oils with Microcrystalline Poly(ethylene butene). Energy & Fuels 20: 250-256.
- Skjæraasen, O.; Oschmann, H.-J.; Paso, K. et al. 2015. Accurate Assessment of Pipeline Restart Behavior at Subsea Conditions for a Highly Waxy Crude Oil Employing Advanced Computational Pressure Wave Modeling. Industrial & Engineering Chemistry Research 54 (16): 4429–4440.
- Paso, K. G. 2014. Comprehensive Treatise on Shut-In and Restart of Waxy Oil Pipelines. Journal of Dispersion Science and Technology 35 (8): 1060–1085. https://doi.org/10.1080/01932691.2013.833105.