Shale gas is fast becoming a source of energy of paramount significance for the coming years. Although commercial production has been achieved in numerous plays throughout the world, the actual physics involved is poorly understood. Molecular simulation is an emerging technique that can be put to use for shale gas. It offers insights into nanoscale properties such as sorption or transport coefficients. The technique is based on numerical simulations at the molecular scale for a given set of pressure and temperature conditions.
Introduction
Comprehensive organic-shale rock characterization performed in recent years has emphasized the dual nature of the porous system, which is split between organic and inorganic pores, each system having its own scales and associated physical properties. At least two clearly identified mechanisms are likely to cause composition changes over time: In tiny pores, where specific surfaces are huge with respect to volumes, gas exists in both free and condensed (adsorbed) states and in different compositions. Because free and adsorbed gas will not be produced at the same time in a well’s life because the process is pressure dependent, a change in the produced-gas-composition stream is likely. In addition, flow through the nanometer-scale pore system exhibits not a Darcy pattern but a diffusion type of flow (transitional or free molecular flow) where transport coefficients depend on the molecule size. This mechanism is well-known in gas chromatography as molecular sieving and also will result in composition changes.
This paper seeks to offer a comprehensive screening of the current means available for representing such effects and to examine their consequence on long-term production with an appropriate model.
Pore-Network Structure in Organic Shales
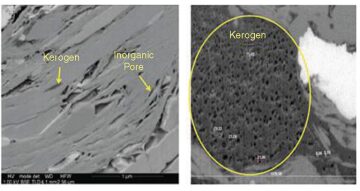
One of the more remarkable features of shale-gas matrix is that it hosts kerogen, whose intrinsic porosity depends upon maturity. Focused-ion-beam scanning-electron-microscope images (Fig. 1) from the Barnett shale in the high-maturity window have shown that porosity can be as high as 30 to 40%. These observations were found to be consistent with previous evidence of strong correlations between gas-filled porosity measured on core samples and total organic content. They provide a means of quantitatively assessing the gas volume split between organic and inorganic pores, which is found to be 80:20 in the Barnett. This figure may vary from one play to another and may be highly dependent on maturity but is considered representative of the high-maturity Barnett shales. Another interesting observation drawn from these images is that kerogen nodules are scattered within the inorganic matrix, which therefore should provide the connectivity for the gas to flow to the well. A large range of inorganic pore types has been observed on images, but all of them support a step change compared with the organic pores (i.e., submicrons vs. a few tens of nanometers). While physics is thought to remain conventional for the former, it will become much more complex for the latter: Adsorbed gas will mostly thrive in the organic pores where flow will be of a more diffusion-transport type.
Nanophysics Modeling for Shale Gas
Storage. The quantity of adsorbed gas that can be held by the rock at a given pore pressure is well-represented by the Langmuir-isotherm model. For gas mixtures, the extended-Langmuir formulation, an extension of the single-component Langmuir, is widely used. Please see the complete paper for the equations.
Transport. Darcy’s law has been used extensively for oil- and gas-flow modeling in a porous medium. It is well-suited for transport through mesopores, whose permeability ranges from the milli- to the microdarcy level, but it fails to predict transport in tight structures such as shales, where diffusional effects can no longer be neglected compared with viscous effects. Pores in these shales typically range from a few angstroms to tens of nanometers. Under such conditions, slippage at the solid/fluid interface cannot be neglected. As the pore size decreases, the flow shifts from no-slip (Darcy) to slip, then to transition and to free molecular flow. The Beskok-Karniadakis (BK) model is a unified formulation designed to represent all types of flow. It is based on a correction factor modifying the permeability, which relies on the Knudsen number. The BK model, therefore, affords insight into the deviation of the flow from the Darcy mode.
Molecular Simulation
Molecular simulation is a compelling computing technique that was investigated as a means to check the reliability of the extended Langmuir and BK analytical models, and it turned out to be essential in highlighting their shortcomings. It, therefore, looks to be a very promising way of providing matrix properties in place of laboratory experiments.
Principle of Molecular Simulation. Today, molecular simulations are not only applied to conceptual systems but also can simulate actual material properties. The authors used both Monte Carlo (MC) and molecular-dynamics (MD) simulations to assess adsorption isotherms in the kerogen and the transport properties of fluids through a slit pore.
MC Simulation of Adsorption. MC simulation is a statistical method for studying the thermodynamic equilibrium state by considering only atom locations and, thus, does not allow for assessing transport properties directly. It is still well-suited to quantify adsorption in a microporous structure. Calculations are performed in the grand canonical (GC) statistical ensemble by imposing chemical potential, volume, and temperature. The main assumption of MC simulations in the GC ensemble—made to reduce computational time by eliminating the necessity of computing solid/solid interactions—is that the kerogen molecules are rigid.
MD Simulation. Contrary to MC simulation, MD is a method used to assess the dynamic properties of the system. It simulates the system’s evolution over time by integrating the classical equation of motion, giving the positions, velocities, and accelerations of each particle in the system.
Molecular-Simulation Results
Prediction of Binary-Mixture Adsorption by Use of the Extended Langmuir Model. The consistency of the extended Langmuir formulation has been checked by comparison with outcomes from molecular simulations. The process entailed the following steps:
- Assessment was made of the Langmuir pure-component adsorption capacity for methane and ethane.
- Estimated volume and pressure parameters were then used to compute the coadsorption capacity for different-concentration mixtures with the extended Langmuir model.
- Mixture coadsorption was simulated by molecular simulation.
- The results were compared with those from the extended Langmuir model.
Comparisons are given first for the low pressure range (0.01 to 1 MPa) and then for a high pressure range (up to 20 MPa). The temperature considered was 338 K.
At Low Pressures. Fig. 2 and Fig. 3 show the adsorption results on kerogen models that consider sensitivities to the dummy Lennard-Jones particle radius (11 and 17 Å, respectively). The dots represent the molecular-simulation results for pure components and mixtures. The solid lines represent the Langmuir-model match on the pure-component molecular simulations for volume and pressure identifications. The dashed lines represent the extended-Langmuir-model forecast based on each component’s volume and pressure for the different mixtures.
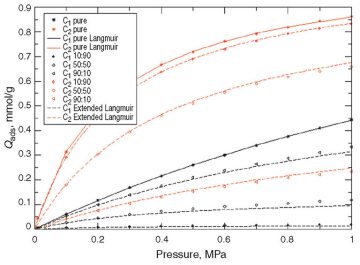
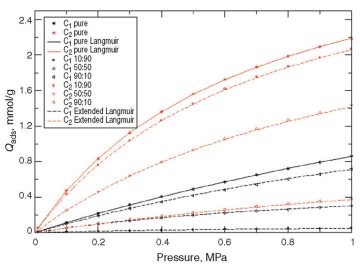
Comparisons between the extended Langmuir model and molecular simulation on mixtures emphasize the effectiveness of the former, at least for the low range of pressures considered.
At High Pressures. The pressure range was widened to 20 MPa. Fig. 4 and Fig. 5 compare the extended-Langmuir-model outcomes with the molecular simulation results for the 11- and 17-Å dummy particle sizes, respectively.
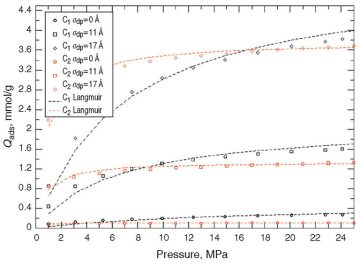
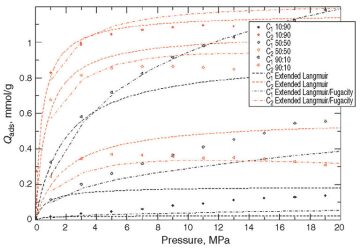
There is an evident deviation of the extended Langmuir model (dashed curves) from the synthetic real data (molecular-simulation output), whereas no such deviation was observed at lower pressures. There is no obvious explanation for the discrepancy, but one possible explanation is that gas mixtures do not follow ideal behavior at high pressures.
In Figs. 2 and 3, dashed lines represent the conventional extended Langmuir model (as a function of partial pressures), while mixed dashed lines represent an enhanced extended Langmuir model. As can be observed, the new extended Langmuir model improves the forecasting capability. The authors strongly recommend implementation of such models in future commercial reservoir simulators.
Application of Molecular Simulation to the BK Model. The authors considered a slit-pore geometry (defined by pore width) and ran several simulations for pure gas and binary methane/ethane mixtures. They investigated the effect of both pore width and pressure. The simulation process involved the following steps:
- First, MD simulations in a GC-like ensemble were run: the slit pore was connected to two reservoirs at the two ends of the pore. The reservoirs were filled with fluid particles at the bulk density. Pressure and temperature were imposed in the reservoirs. This stage allows us to determine the fluid density in the pore at given thermodynamic conditions and pore size.
- Nonequilibrium MD simulations were then run in the slit pore, only at imposed temperature and density. The flow was controlled by imposing a gravitational force parallel to the solid walls.
Flow of Pure Methane Through the Slit Pores
The conclusion from the results was that, for the conditions typically encountered in shales and within the pressure range considered, the BK model correctly predicts mobility in the wide pores (approximately 78 Å) but gives only qualitative values for narrower pores.
Conclusions
- Molecular simulation has been investigated as a means to provide actual parameters that would be difficult to obtain experimentally. It has been used to challenge analytical formulations developed for both storage (extended Langmuir model) and transport (BK model) in a nanoporous medium.
- The extended Langmuir model looks ill-suited to represent coadsorption for binary gas mixtures (C1/C2). However, it would be possible to improve the model by replacing partial pressure with fugacity in the formulation.
- The BK model provides a fair estimation of pure-gas mobility in an ideal porous medium but is ill-suited for binary gas mixtures (C1/C2) at high pressures. One of the main pitfalls is the way dynamic viscosity should be determined.
- With the base-case-model parameters and the nanoscale-properties input modeled with the extended Langmuir and the BK model, the trend (but not the magnitude) of the composition changes was captured. This emphasized the need for additional work to be carried out to determine complex-gas-mixture properties by use of molecular simulations.
This article, written by Special Publications Editor Adam Wilson, contains highlights of paper SPE 164790, “Molecular Simulation To Determine Key Shale-Gas Parameters and Their Use in a Commercial Simulator for Production Forecasting,” by F. Gouth, Total; J. Collell and G. Galliero, Université de Pau and Pays de l’Adour; and J. Wang, École Centrale de Pékin, prepared for the 2013 SPE Europec/EAGE Annual Conference and Exhibition, London, 10–13 June. The paper has not been peer reviewed.
