For the past 20 years, the diagnostic fracture injection test (DFIT) has been used across the frontlines of the shale revolution to paint a picture of what cannot be seen. However, that picture has not always been so clear in the eyes of subsurface engineers.
It is not the test has been questioned. It is the way a DFIT is analyzed.
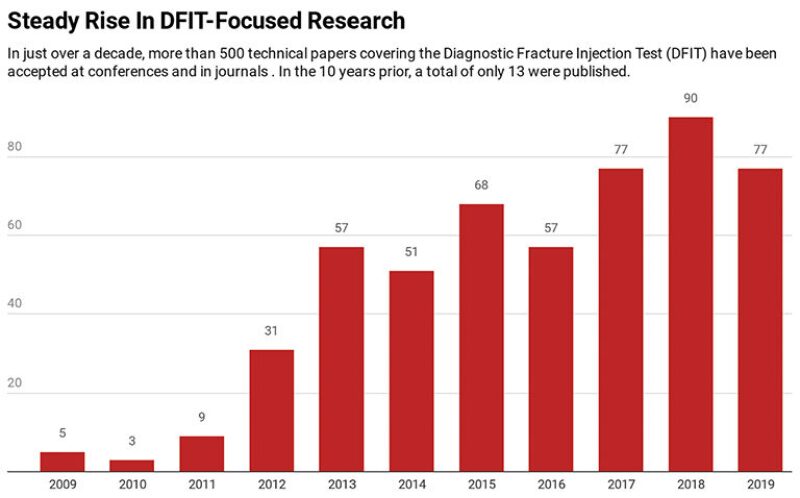
Last year, a joint-industry project supported by six shale producers formed to develop a new methodology that aims to bring fractures into sharper focus—especially when it comes to obtaining accurate permeability estimates from within shale gas formations.
The operators who funded and shared field data for the project were ConocoPhillips, Hess, Shell, Equinor, Range Resources, and Apache. The other key participants included oilfield services firm Keane Group (recently renamed NextTier Oilfield Solutions) and a startup called ResFrac whose software was used to run the study’s models and numerical simulations.
The group’s existence reflects both the rising value of pressure data in unconventional engineering and the struggles industry has in trusting it. The outcome of this yearlong study though hopes to improve upon the latter. The group has offered to the unconventional sector a new template for DFIT analysis, one that represents a distinct alternative to the classical methods used by most practitioners today.
“We have a slightly different conceptual approach, and that impacts a lot of details. So it was necessary to basically start from scratch and make a new procedure,” said Mark McClure, a principal researcher in the industry study and the chief executive of ResFrac.
The new procedure is the centerpiece of two technical papers recently shared at the Unconventional Resources Technology Conference (URTeC) in Denver, and the SPE’s Annual Technology Conference and Exhibition (ATCE) in Calgary.
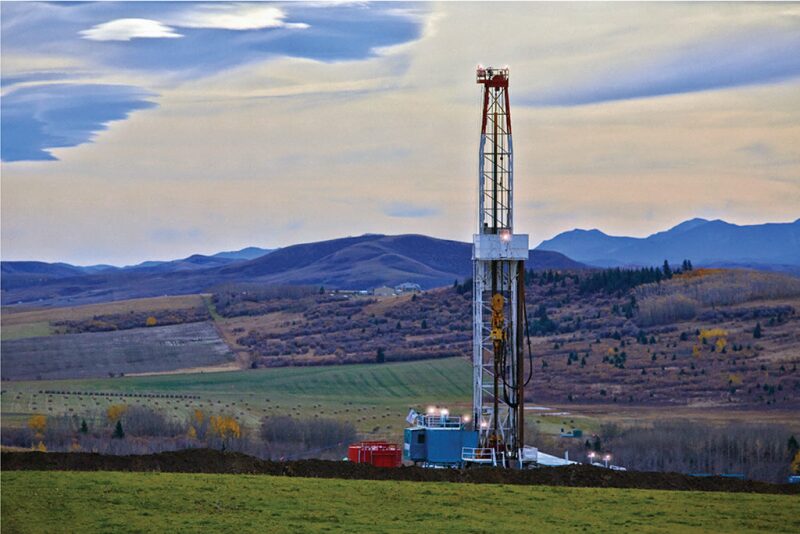
Usually performed at the toe-end of a horizontal well, a DFIT involves pumping a small volume of fluid (typically 20 bbl or less) into the formation to induce a small fracture. How that fracture seals back up is then measured over a period that usually spans a 1–3 weeks.
The test is used widely across shale plays to obtain estimates of rock stress, pore pressure, and, perhaps most importantly, permeability. It has become ubiquitous in the shale sector because it is an affordable way to quantify such properties before a pressure pumping crew arrives on a well pad. Additionally, where rock cores are susceptible to stress and permeability changes as they are brought to surface, the DFIT represents an in situ measurement that avoids these issues.
However, the operator-led study asserts that the shale sector has misinterpreted the signals provided by a DFIT. The reason: accepted interpretation methods were largely designed for conventional reservoirs that feature far simpler physics than those that dominate tight-rock formations. The result: a systematic inflation of permeability estimates in gas shales and, to a lesser extent, inaccuracies in permeability estimates of oil shales.
According to the study group, the problem is far more pronounced in gas shales where fluid interactions are harder to discern. In overshooting permeability, a gas shale producer may be blind to the fact that it is drilling infill wells too close together, risking excessive fracture interference and reserve acceleration.
Based on operator data from eight shale plays in the US and Canada, paper URTeC 123 explains how petroleum engineers can avoid such errors by changing how they calculate critical parameters. The paper includes 20 pages of equations.
McClure said the mathematics shared within amount to “a practical, step-by-step procedure” that enables anyone to run the new interpretation using nothing more than a spreadsheet. And while delivering a sharply different view of DFIT analysis, the procedure incorporates and builds upon many existing techniques.
“The goal of having 20 pages of derivations is to make sure that it’s crystal clear what we’re doing and why,” McClure said, emphasizing that, “This is all intended to be applied.”
There are three major differences between the new numerical model-based approach and classical DFIT interpretation methods. All reflect the challenges imposed by nanodarcy permeability formations: how fractures close, the leakoff rate of the fluid from the fracture, and the role of multiphase flow.
Notably, the approach is non-proprietary. The ultimate goal of the study participants is for the firms that develop pressure transient analysis software—which are distinct from numerical simulators—to eventually include it as an option in their programming.
McClure said so far at least one such vendor, FracPro, has committed to begin implementing the new procedure next year. Echoing the spirit of the open source software movement, he added, “I hope that the community might be able to improve on it.”
Fractures May Be Longer Than You Think
Though the new method should also help fine-tune DFIT analysis in oil-bearing shales, it is in a gas shale that interpreters face the highest risk of making the wrong permeability assumption. In gas shales, there is a far higher contrast between the fracturing water leaking off into the rock than the fluid that is already inside the rock. This leads to rapid pressure drops, which often represent false signals to the interpreters.
The ATCE paper (SPE 195980) uses a case study from the Utica and Point Pleasant shales to highlight how inaccurate permeability estimates can affect an entire development program. The paper authors, from Hess and ResFrac, selected this region of the Appalachian shale gas system in part because operators there have historically obtained high-permeability estimates via DFIT analysis.
The warning issued throughout the paper is that high-permeability estimates too often imply that effective fracture lengths are “implausibly” short and small. It could seem that those lengths are only 30 ft when in fact the conductive portion of the fracture is closer to 300 ft.
Higher permeability and lower effective fracture length assumptions will in turn suggest to an operator that fracture cluster spacing should increase while optimal well spacing is relatively tight.
Under the newly proposed DFIT analysis method, completions engineers would be inclined to conclude the exact opposite. They would likely hold that the permeability is lower and the fractures are longer, therefore clusters should be placed closer together, and wells spaced farther apart.
As the authors point out, in an unbounded drilling scenario the production effects are hard to detect and only become easily discerned as infill wells are established: “Models history matched with the lower permeability assumption have longer effective fracture lengths and exhibit earlier production interference between adjacent wells. This is consistent with operator experience that outer wells outperform inner wells within months or even weeks of placing the wells on production.”
The issue appears to be glaring but there is a reason that the red flags are difficult to see during the evaluation stage of a play. That is because production data, i.e. rate transient analysis (RTA), is often used to history match the DFIT-derived permeability figure. The big problem lies in the fact that RTA delivers non-unique answers, which means “production can be matched with a wide range of permeabilities.”
In a separate but supporting paper shared last year by Hess (SPE 189838), the operator highlighted that DFIT analysis suggested its target reservoir in the Utica and Pleasant Point had a permeability of about 1 microdarcy. The figure was deemed so “anomalously high” that the technical staff threw it out. When the alternative DFIT analysis method was used, the estimates dropped to 10–20 nanodarcy.
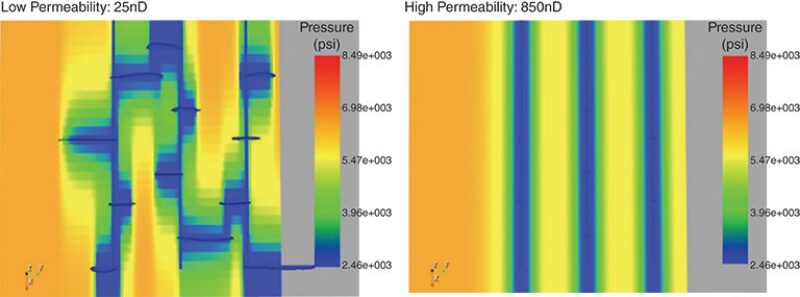
This experience served as an experimental template for the subsequent simulation run jointly by Hess and ResFrac. Two models were set up to history match real-world production data using permeabilities of 25 nanodarcy and 850 nanodarcy. The simulations are not to be taken literally or offer design recommendations. Instead, they are meant to shine a spotlight on this question of plausibility.
The “hi perm” model needed a fracture for each cluster so small, an area of about 95 ft by 50 ft, that it was not possible to perform a hydraulic fracture simulation. The modeler instead had to eliminate hydraulic fracturing from the simulation and replace it with a preexisting fracture.
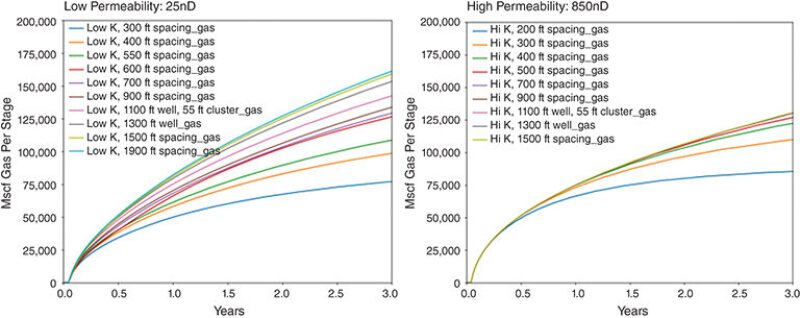
While both high and low permeabilities were successfully matched to production, the simulations reveal they have vastly different fracture geometries. The high-permeability model shows no well-to-well interference for several years. The low-permeability model generates an abundance of fracture overlap and production interference from the onset, along with non-uniform cluster efficiency.
The high-permeability model also suggested that optimal spacing was just 400 ft with 13 wells per drilling section. The low-permeability model yielded 750 ft spacing with only seven wells per section. “The difference in cluster spacing is even more pronounced—25 ft versus 75 ft,” the paper adds.
Economic outcomes are strongly influenced by these contrasting outputs. The high-permeability model resulted in a 30% drop in the field’s net present value compared with the low-permeability model. The paper authors wrote that had they not held several parameters constant, and attempted a full optimization instead, these figures “may have been even more pronounced.”
The asset used for this case study is no longer owned or operated by Hess.
Fractures Close, But Not All The Way
The new DFIT analysis hinges in large part on a concept known as the “compliance method,” which is used to determine how and when a fracture has closed—marking not just the end of a DFIT, but the point at which its most valuable data is acquired. The method was first proposed more than 3 years ago by McClure and other researchers from the University of Texas at Austin (UT) and ConocoPhillips.
This work, which was done while McClure was an assistant professor at UT, represents one of the biggest challenges to accepted practice.
Induced fractures are essentially openings with two walls. But since rocks are rough, not smooth sheets, the fracture walls may close but will never seal together as tight as the moment before the fracture was created. The newly minted term for this type of closure is “imperfect mating.”
On the other side of the DFIT debate is the classical assumption that the fracture walls do fully close, or at least enough to stop any meaningful fluid movement within the fracture. This has been termed as “perfect mating.”
The DFIT study contends that in unconventional formations, “perfect mating” is unrealistic and that “imperfect mating” is common. In the new interpretation, fractures are assumed to be closing at higher pressures which results in a small aperture within the fracture that leaves plenty of room for fluids to sustain some level of flow.
Though minute, any opening inside a fracture results in major differences in how models interpret the physics of fracture behavior vs. one believed to be closed. If the model is told the fracture is sealed, stress will be on the low side, and permeability estimates will be on the high side.
The Hess paper from last year mentioned that the compliance method has been the subject of “considerable debate” within the world of fracture diagnostics. The paper’s authors emphasize that the two methods deliver results that are “considerably different and merit discussion.”
Leakoff Mechanism and Multiphase Flow
The second big difference is a deviation from another classical method known as the Carter leakoff model, or simply the Carter equation. “Carter leakoff is a very simple assumption about how fluid leaks off from fractures,” explained McClure. “It’s valid if the fluid pressure in the fracture is not changing over time—and that’s a reasonable assumption under some circumstances.”
But in unconventional rocks, DFIT data show that pressure can fall dramatically. McClure stressed that the pressure drops until these leakoff events “are nothing like Carter leakoff.” The new method recognizes the sharp falloffs and that fluid remains in the fracture throughout the test period.
Representing yet another nuanced debate, the last major departure from conventional thinking revolves around multiphase flow. This issue involves how the fluids at the end of the test are moving out of the small, induced fracture of a DFIT.
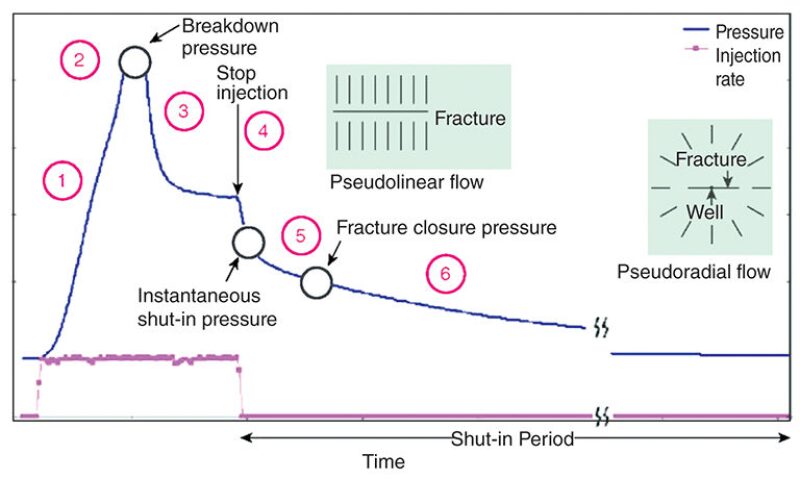
Conventional understanding assumes that a linear flow regime should be followed by radial flow regime. This final and critical transition of a DFIT is an indication that formation fluids are spreading radially away from the fracture, rather than flowing predominantly away from the fracture face in a linear way. The transition is diagnosed from a characteristic trend in the pressure transient data.
The DFIT study contends that in a gas shale, the viscosity contrast between the injection fluid and formation fluid causes a pressure signal that appears to be radial flow, even though the flow remains linear. If such a “false radial” is taken at face value, then radial flow-based permeability estimates tend to be 10–100 times greater than they are in reality.
The easily misinterpreted signature was seen in every gas shale DFIT simulation performed during the course of the study, and each one generated an overestimate. The simulation predictions were later confirmed with field data, which also showed that the false signal was present in a majority of gas shale DFITs.
For Further Reading
URTeC 123 A Collaborative Study on DFIT Interpretation: Integrating Modeling, Field Data, and Analytical Techniques by Mark McClure, Res Frac, et al.
SPE 189838 Case History of Completion Optimization in the Utica by Craig Cipolla, Hess Corp., et al.
SPE 163863 Diagnostics Fracture Injection Testing Tactics in Unconventional Reservoirs by David Cramer, ConocoPhillips, et al.
SPE 179725 The Fracture-Compliance Method for Picking Closure Pressure From Diagnostic Fracture-Injection Tests by Mark McClure, University of Texas at Austin.
SPE 195980 Utica Case Study: The Impact of Permeability Estimates on History Matching, Fracture Length, and Well Spacing by Garrett Fowler, ResFrac, et al.