Editor’s Note: The November edition is a written column only, with the vodcast set to resume next month.
SPE finances are not the most interesting or exciting topic for most members, and you will be forgiven if you pass this column.
You may not be interested at all if you only want to know what SPE does. However, you may be interested in this column to understand how SPE functions financially.
SPE is not a commercial business, but it has an events business that de facto finances most of its other services to members—direct membership fees are a relatively small part of SPE’s revenue. In the current model, if the events business fails, SPE collapses.
Finances are always important, but they have become critical in the current context, including the 2015 downturn and the 2020 COVID-19 pandemic, especially the latter, which have brought an existential threat to our Society.
As shown in Fig. 1, between 2014 and 2023, we lost 65% of our revenue, 200% of our profit (Net Operating Income), and 50% of our net assets. Even last year, 3 years after the pandemic, we still had an operational deficit of $3.6 million, and this was expected to be a “good year” with Offshore Europe and two Offshore Technology Conference events. Operationally, we are still hemorrhaging money.

SPE’s finances are public, but I thought it would be good to present this information in plain English and with illustrative graphs to explain how we operate financially and how SPE can prevail while its traditional business model is being challenged.
I have occasionally heard and read severe statements about SPE’s financial management, allusions to staff being oversized and overpaid, our lack of willingness to adapt, etc. So, it is also a good opportunity to clear up some of these misunderstandings.
Conventions and Definitions
Until 2024, SPE’s fiscal year (FY) started in April and ended in March. For example, FY24 started on 1 April 2023 and ended on 31 March 2024. This has recently changed and will be explained below.
The numbers presented in this document are consolidated in USD (SPE has several offices handling different currencies) and corrected for US inflation using factors listed in Fig. 2. The reference is the USD from the middle of FY24, i.e., October 2023.

One important result to gauge our operational results is our Net Operating Income (NOI), which would be equivalent to profit if SPE were a commercial venture.
Evolution of SPE’s Net Operating Income (NOI)
One may be tempted to doubt SPE’s management when looking at our NOI over the past 15 years (Fig. 3). SPE had 6 consecutive years of operational deficit from FY19 to FY24 and only 1 year with a small operational surplus in the past 10 years.
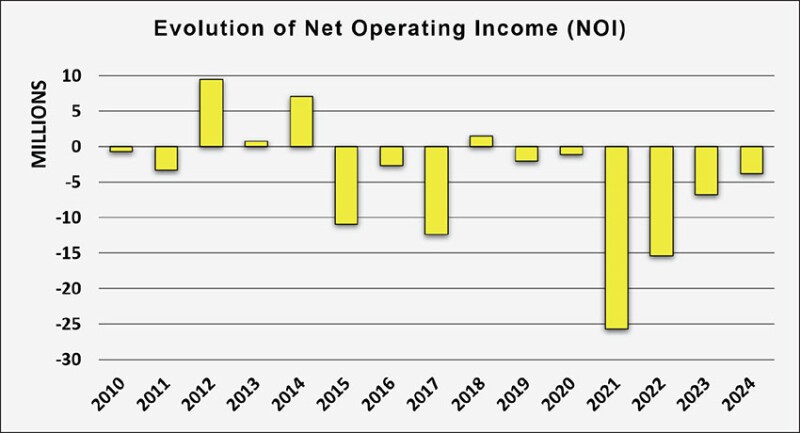
Any executive team presenting this sort of result in a commercial company would have been escorted out of the building as early as 2017. But …
The Difference Between Commercial and Not-for-Profit Organizations
SPE is not a commercial company, and the difference must be understood before drawing any conclusions. Before entering the details of our financial situation, I will start by reminding you of the specifics of a not-for-profit organization such as ours.
Fig. 4 shows schematically how the accounting logic of a commercial company and a not-for-profit organization differ. The NOI is the difference between revenue and expenses for a commercial company (left). The objective is a positive NOI. Profits accumulate, and the stakeholders, who are the shareholders, are rewarded with dividends.
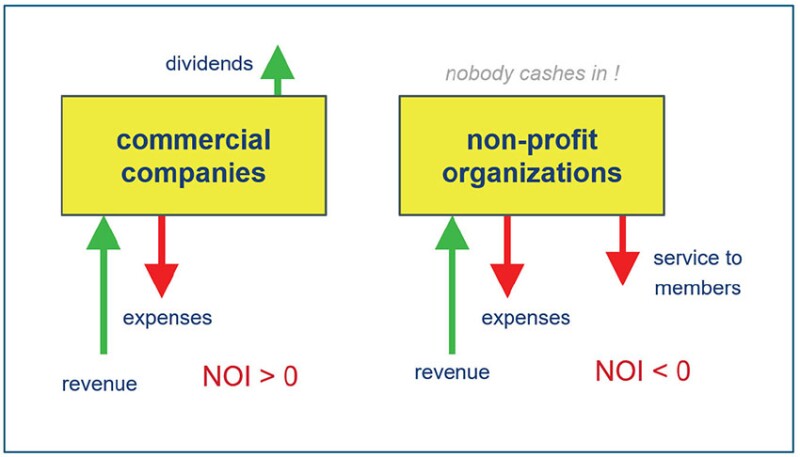
In a not-for-profit organization such as SPE (right), members are not served a cash dividend. Rather, service is delivered through expenses that contribute negatively to NOI.
When a not-for-profit organization accumulates assets in a series of years of positive NOI, the only way to return this value to members is through a negative NOI.
Negative NOI is even more frequent in organizations with nonoperational revenue, such as investment returns and, in our case, the SPE Foundation. As these additional funds flow, the only way to convert these into service to members is through a negative NOI.
In other words, not-for-profit organizations with some nonoperational revenue may have a structural negative NOI while being perfectly healthy, correctly managed, and even with growing net assets. This was the case for SPE for many years before the 2015 downturn.
Conclusion: A year with a negative NOI may not be a bad year or a sign of bad management. It simply may be a year when the organization decides to deliver more services to members than its operational results could provide. But it may also be a bad year, and a not-for-profit organization may also be badly managed.
To properly assess the situation, we need to differentiate, within our expenses, the real operational expenses from services provided to members. The boundary is not so easy to define.
- When SPE had to cancel events during the pandemic and indemnified hotels and convention centers, this was an operational expense with no profit to members. FY21 was, definitely, a very bad year.
- When SPE provides scholarships to students, it is a service to members.
- When SPE provides services to members using staff time or a contractor, one may argue that we have a bit of both, that the same service could have been delivered differently at a lower cost, etc.
We need to dive deeper to assess and understand the actual situation for SPE. The sign of the NOI is just not good enough. So, let’s dive …
Analyzing the Components of NOI and its Evolution
Fig. 5 shows the NOI of each analytical component of SPE’s activity, again corrected for inflation. The sum of the five components is SPE’s total NOI shown in Fig. 3.
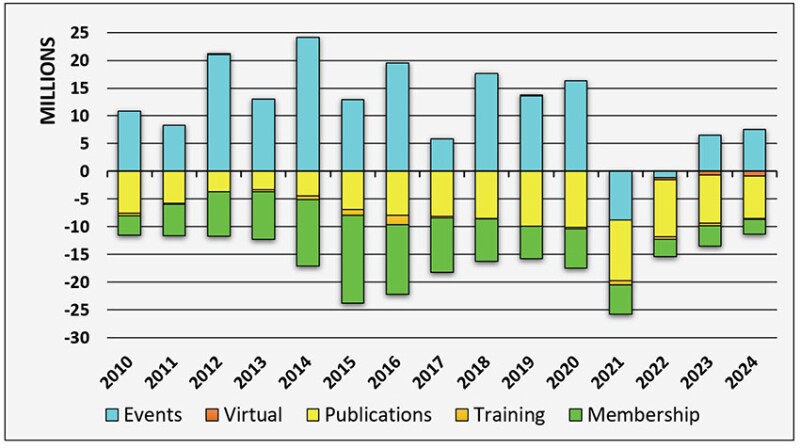
Fig. 5 illustrates the traditional business model we followed pre-pandemic. Historically, events have served as the primary financial engine for SPE, supporting other activities that, while offering some revenue potential, are primarily designed to serve our members and deliberately have an operational deficit.
Events were only in deficit during the pandemic in FY21 and marginally in FY22, as was the case for most events-based commercial and not-for-profit organizations worldwide. We are back to profitability, which tends to establish that SPE, as an “events business” is pretty well managed. This is the half-full part of the glass.
The half-empty part is that our global model suffered during the downturn and nearly imploded with the pandemic. Events are profitable again, but the new normal is far from pre-downturn or pre‑pandemic levels. The numbers no longer add up.
Worse yet, examining the past 4 years of Fig. 3, repeated in Fig. 6 (left), may be interpreted as if SPE was slowly returning to a balanced operational result.
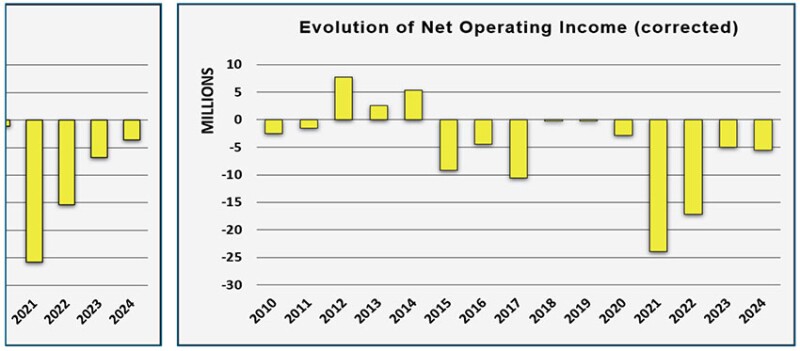
Unfortunately, fiscal years with an even number, like FY24, are exceptional, hosting three major events (Offshore Europe, OTC Brazil, and OTC Asia) and bringing $4.4 million in additional net revenue every second year.
This cyclical boost distorts the overall financial outlook. If we correct for these cycles (adding $2.2 million to odd years and subtracting $2.2 million from even years), we see the correction in Fig. 6 below, on the right. After this cyclic correction, it seems that we brutally returned to a new normal in FY23 and that we still have a structural operational deficit of $5.7 million per year.
What Was Done in the Wake of the Pandemic Until FY23 (Included)
One can imagine the frustration of the SPE Board of Directors and SPE staff when the two waves of crises hit us. This was especially the case for SPE Presidents, who generally come back to the board with enthusiasm and many projects, only to be met with a pandemic, zero travel, zero physical meetings with sections, and a financial nightmare. There was little choice but to react as best they could under the most trying circumstances. All events went virtual during FY21. The first in-person, post-pandemic event took place in May 2021.
Then there was a succession of disappointments between budgets and effective results. Despite that, no decisions were made to aggressively cut costs to drive a rapid return to a balanced result, as would have been the case in any commercial company.
The board and staff tried to limit the damage while preserving services to members. SPE received $5 million from the Paycheck Protection Program (PPP) from the US Small Business Association (SBA) and $2.9 million of Employee Retention Credit. The loans were later forgiven by the SBA. The decision not to cut costs further and faster is debatable, but in retrospect this was probably the right thing to do (or not do).
What Was Done in FY24 (April 2023 to March 2024)
FY24 was expected to be a transition year with the arrival of Simon Seaton as SPE’s new CEO. Still, a lot was accomplished this year with Seaton, under the leadership of 2024 President Terry Palisch, and with 2023 President Med Kamal leading the SPE Finance Committee.
- Publishing books, in decline and structurally in deficit, was terminated. The inventory write-off and transfer to PennWell created an exceptional deficit of $640,000 in FY24. This will produce a long-term saving of $500,000 per year.
- The physical London office was closed, and 14 positions were eliminated. Seven employees now work remotely in the UK reporting into the Dubai office to support European operations, including Offshore Europe. Two positions in the US were also eliminated in the wake of this decision. This created an exceptional deficit of $340,000 in FY24 for both severance packages and the costs to close the London office. This will produce a long-term saving of $1.5 million per year.
- GEODE. We signed a contract with the US Department of Energy and Project InnerSpace to expand technology transfer activities into geothermal energy. This will create $600,000 of activity in FY25, with the potential for further growth in subsequent years.
As the two first actions produced around $1 million of exceptional write-offs in FY24, the real operational FY24 deficit was $2.6 million (not $3.6 million). The structural deficit after correction for odd/even years was $4.7 million per year (not $5.7 million per year).
What Is Coming for FY25 (April 2024 to March 2025)
The closures of the print book business and the London office will save SPE $2 million annually. With other measures not detailed here, the structural deficit is now reduced from $4.7 million to $2.5 million annually.
Our budgets for FY25 and FY26 are now targeting a 2-year average (small) operational surplus. This means $2.5 million of yearly improvement to compensate for our remaining structural deficit. While this target is not unreasonable, it is also far from guaranteed.
To be exact, the approved budget for FY25 includes a negative NOI of $2.2 million, and the budget projected for FY26 includes a positive NOI of $2.95 million. As a reminder, this oscillation around zero is mainly related to the expected $4.4 million of net revenue from three large events in even fiscal years.
We are 6 months into FY25 and on course to meet the budget. However, our position remains precarious and vulnerable to unforeseeable events. We are stretching our traditional business model to its limit. We must identify new sources of revenue beyond events, or we will have to make further cost reductions.
Indeed, we may need to do both.
- We recently signed a contract with Saudi Aramco and i2k Connect to develop a generative AI project called the Energy Large Language Model (ELLM). The details of the project will be shared in another column. The ELLM will be donated to SPE and then licensed, which could constitute a new source of revenue.
- We are working on a consortium project, with a financial component focused on a global sponsorship scheme for high-profile programs that SPE is currently financing. If and when the project is approved, we will provide more details.
- We have identified other potential cost savings, which are again not detailed here.
Long story short, we need to reach a comfortable operational balance by the end of FY26, and even before, considering the change of fiscal year described next.
Changing SPE’s Fiscal Years
As explained previously, we have a disproportionate 2-year cycle related to three major events (Offshore Europe, OTC Asia, and OTC Brasil).
Having a “noise” of $4.4 million amplitude while counting pennies to achieve operational equilibrium does not help. We have realized that changing the limits of the SPE fiscal year from April–March to October–September would solve the problem.
This might be interpreted as an accounting trick, but it is a very valid one. It would also synchronize the fiscal years with the board rotations, which has many operational and structural advantages.
With this change, Offshore Europe will fall in odd fiscal years, while OTC Asia and OTC Brazil will remain in even fiscal years. There will be a balance, and this adjustment will allow each fiscal year to accurately reflect SPE’s actual financial performance.
The change will take place in 2025, with the insertion of a short, 6-month fiscal year (FY25b) from April to September 2025 (Fig. 7). The related cost will be limited as we will run a single audit covering both FY25b and FY26.
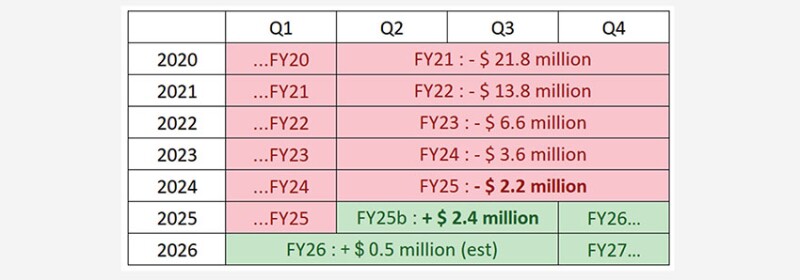
With Offshore Europe, the short FY25b should have a positive NOI. Under these conditions, a positive result would be nothing to brag about. However, if the FY25b surplus exceeds the FY25 deficit, we will have reached equilibrium after 6 years.
Nonoperational Revenue Affecting SPE’s Net Assets
Beyond the operational NOI, other elements affect SPE’s assets year after year such as investment returns, contributions from the SPE Foundation, and other exceptional elements, such as the COVID-19 Relief Fund in FY22.
Fig. 8 shows all four components combined with NOI. The sum of these elements is the change in the SPE net assets.
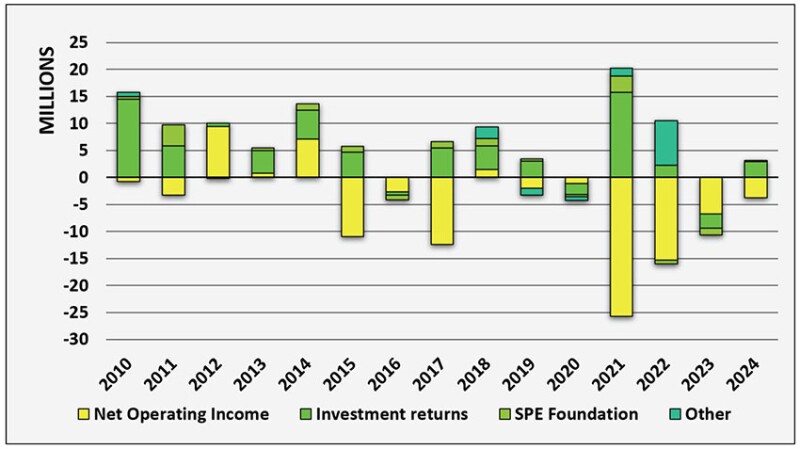
In FY21, a record return on investment and a contribution from the SPE Foundation substantially reduced the impact of the huge operational deficit resulting from the pandemic. The same occurred to a lesser degree in FY24, where there was a small increase in net assets despite the negative NOI. Conversely, a negative return on investment and a divestment from the foundation amplified the FY23 deficit.
From experience, we know that we cannot count on nonoperational revenue year after year. This is why we need to return to an operational surplus, counting on nonoperational revenue only to rebuild our assets.
Evolution of SPE’s Net Assets
Fig. 9 shows the evolution of our net assets over the past 15 years. These include investments, properties, liquidities, and other holdings at the close of each fiscal year.
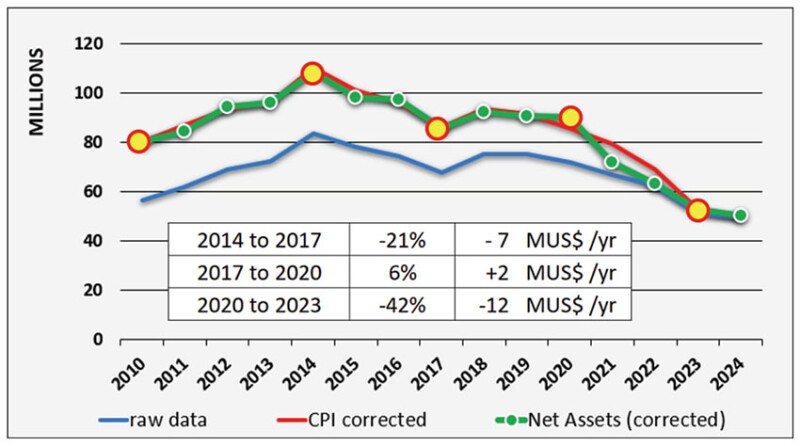
The blue curve represents the raw data in USD, while the red curve adjusts for inflation reference October 2023. The peak of $80+ million at the end of FY14 corresponds to more than $110 million today.
The green curve with markers is the best indicator, but it is a bit more complicated. It averages nonoperational revenue over time, reflecting more on the impact of SPE’s operational performance on our assets.
After these corrections, SPE lost 20% of its net assets during the downturn, followed by a modest recovery. Then SPE lost 40% of its remaining assets in the 3 years following the pandemic. Things stabilized last year, with a small increase in USD terms and a minor reduction after correcting for inflation.
SPE’s Sustaining Fund and Financial Health Check
Sustaining funds correspond to 6 months of SPE’s operational expenses. An accepted way to check the financial health of an entity is to see if this entity’s available funds exceed the sustaining funds (Fig. 10).
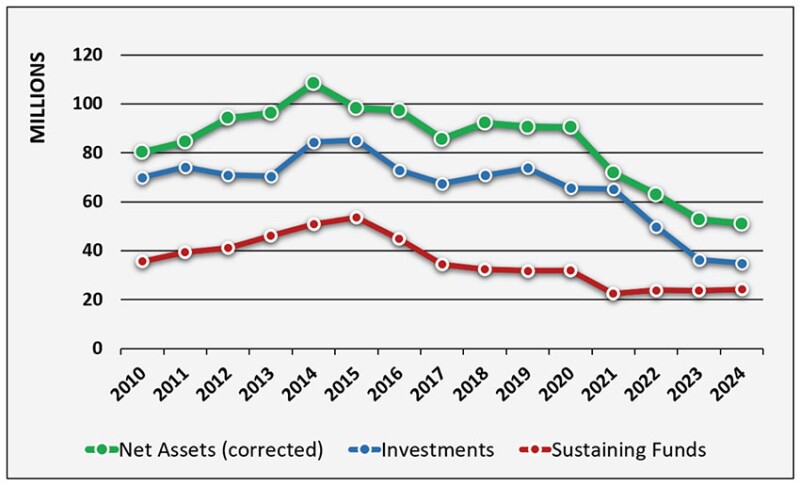
Generally, available funds include both cash and investments. SPE, however, takes a more conservative approach and only uses investments.
If we balance our finances within the next 2 years, our investments will remain well above sustaining funds, and our financial situation will be healthy.
The margin will be even wider after the sale of our building in Richardson, Texas, which will be partly allocated to increase our investment funds.
The Role of SPE Staff
There is a fashionable trend among some of our members to attribute SPE problems to the staff. Among other objections we hear, there are too many staff and they are overpaid. I remember social media threads where the salaries of the most senior staff (they are public) were compared to the salaries of the then-SPE presidents (zero), as proof of how scandalous the staff situation was. There are several points to be made here.
- Naturally, one should not compare staff salary, which is professional income, to the volunteer nature of being president (or any volunteer function within SPE). Whatever the salary of staff, the ratio will remain infinite. The real question is whether these salaries are consistent with “market value.”
- One of the first questions I asked when rejoining the board was to obtain a benchmark with similar positions in comparable organizations. The study showed that most salaries were well within the norm; maybe some were slightly above average, but only with a single-digit percentage difference. This is typical for organizations with a low turnover and where seniority is valued. Considering the steep learning curve to manage events and programs like those SPE supports, having experienced staff paid a bit more is a good thing.
- SPE staff have had a rough ride in recent years. There was a continuous reduction in headcount, from 390 at its peak in May 2015 to less than 240 today. Staff took a 5 to 15% pay cut in 2020, only restored to pre-cut levels in 2022. Staff salaries did increase in FY23 and FY24, but these raises did not fully compensate for inflation. The variable compensation plan (akin to profit-sharing for a not-for-profit entity) was suspended in 2020 and will not be reactivated until we balance our operating results.
- Since the pandemic, we have not replaced most of the positions that were eliminated, so many activities have been transferred to the remaining staff. In short, they are busy.
- Still, there are problems. The staff cost structure adapts well to our core events business, but we have often seen that it was too expensive when we tried to extend our activity to other domains. High-value staff easily pay for themselves when organizing workshops, forums, and conferences, but can be seen as a financial burden for activities like training or local section events. We are actively addressing this.
Conclusion
I warned you this might be boring.
In a nutshell, we are nearing the end of a recovery process following two very serious crises. We will not return to our pre-downturn or pre-pandemic financial positions in the foreseeable future. Still, we have adapted our cost structure to reasonably target a balanced result (not only a balanced budget) next year or the year after. To ensure a secure financial situation, we must pursue the additional sources of revenue we are working on right now.
If we return to equilibrium, this will retroactively validate the action of the previous boards, which decided not to react like a commercial company.
Our huge deficit in the past 5 years was not money thrown out the window. Except for the lockdown periods where a lot of money was contractually lost in exchange for little, the deficits we endured later were only the result of service to members that we kept to nearly the same level while events revenue was still missing. By not laying off staff in a knee-jerk reaction, we have kept the know-how, allowing us to rebound and enable our recovery.
We must also credit the past boards and staff when, over a decade ago, they accumulated sufficient assets to weather these financial storms and allow us to land safely. Having such a financial cushion made the difference.
In turn, if … no, when we manage to balance our operational activity, we should use our nonoperational revenue to rebuild our assets preparing us and those that follow for whatever next is thrown at us.
I was anticipating that this column would be much shorter than the previous one … not quite.
Next month’s column will be on SPE’s governance.
Visit my SPE Connect channel, “President JPT Column–Discussion Page,” to share your thoughts and insights.

