
Getting Started
This is my sixth JPT column as 2025 SPE President. Hopefully, it will be the last excessively long one. So far, I have tried—as extensively and neutrally as possible—to share my perspectives on the realities (and most often, the challenges) that we face in SPE: energy transition, finances, governance, quality, and now membership.
Our “SPE reality” is both complex and multidimensional, with these dimensions being interconnected and not to be addressed separately. The most obvious connections are SPE’s financial constraints and the costs that occur when solving individual problems, particularly when trying to do so in isolation. As an organization, SPE needs to balance its resources and actions—and frankly, we need additional sources of revenue to address all these challenges in parallel.
However, these are not the only complexities. SPE also faces many issues on which our membership holds diverse and potentially conflicting opinions (e.g., energy transition, governance, and publication quality). We are a point where even stating an issue may be considered provocative (e.g., the “SPE” name, Society of Petroleum Engineers).
Even attempting to propose a neutral position on topics outside our mission may not be acceptable to the most opinionated individuals on both sides of a particular issue. In such circumstances, it is very tempting to put some matters in the ‘much-too-difficult’ bin, but in reality, putting our heads in the sand is not an option. This is generally true (i.e., our industry is too critical, we cannot defer/deflect difficult issues), but especially relevant now, as converging challenges and competing risks affect our industry.
With those conditions in mind, let me return to this month’s focus: the evolution of SPE membership.
SPE Membership and Demographic Challenges
Recent Challenges Related to the 2015 Downturn and the 2020 COVID-19 Pandemic
SPE’s membership statistics are summarized in Table 1.

In the recent past, between 2015 and 2021, SPE lost one-third of its professional members (dropping from 99,000 to 66,000). Professional membership has somewhat stabilized now.
In addition, we lost 14% of our student membership. Fortunately, SPE student membership has grown significantly since 2021, approaching 2015 numbers.
The statistics in Table 1 are not great, but neither are these numbers particularly alarming. In aggregate, our SPE membership is down, but our current membership is above the 2008 level and stable. Our main concern at present is the demographics of this membership, especially the low number of young professional (YP) members. This scenario can (and will) lead to serious issues in the decades to come, much like the demographic gap we experienced following the 1985 downturn.
I could focus solely on the YP problem—this would shorten this column, to the delight of the reader and our JPT publication staff. Instead, I will provide some historical context for our membership statistics. What we face today is not the first time, although it may be, statistically, the worst of times.
A large proportion of the “downturn” events occurred during my career, and I will take the risk of adding my personal perspectives. You are welcome to skip these if you wish to stick to membership statistics, but I will make several attempts at entertaining you with my own experiences and perspectives.
Global Historical Perspective of SPE Membership
Let’s first revisit the evolution of SPE membership since its founding in 1957 when SPE became an independent entity, and our numbers began from there. I will then relate our SPE membership statistics to the major geopolitical events that strongly affected (if not dominated) our membership numbers.
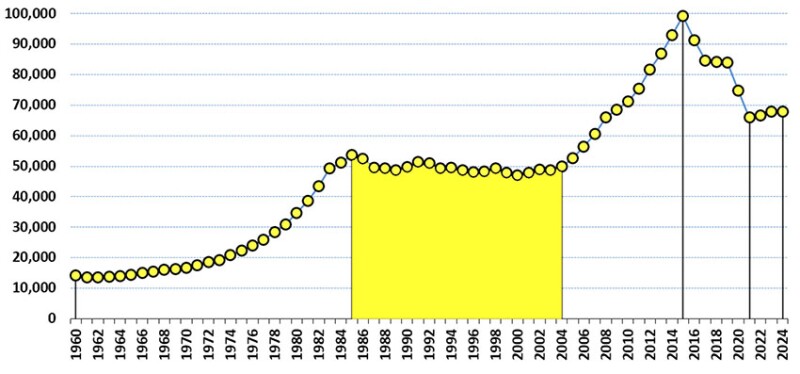
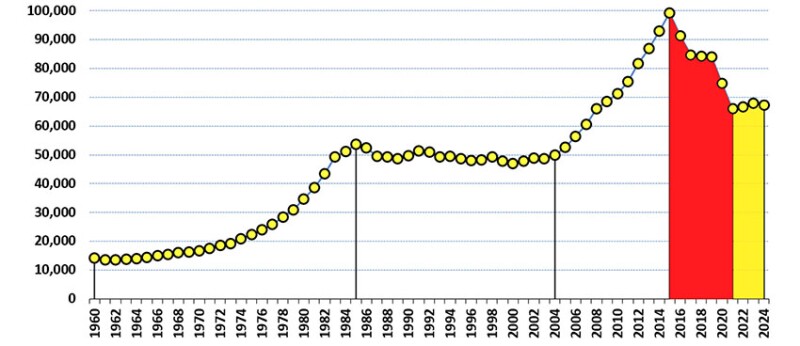
Let us begin with a visualization of professional and student SPE membership since 1960 (Fig. 1). Note that we are missing data for 3 years (1957–1960). While these data would have been helpful, there is not much to be learned from the 1957–1960 membership statistics, particularly in a modern context.
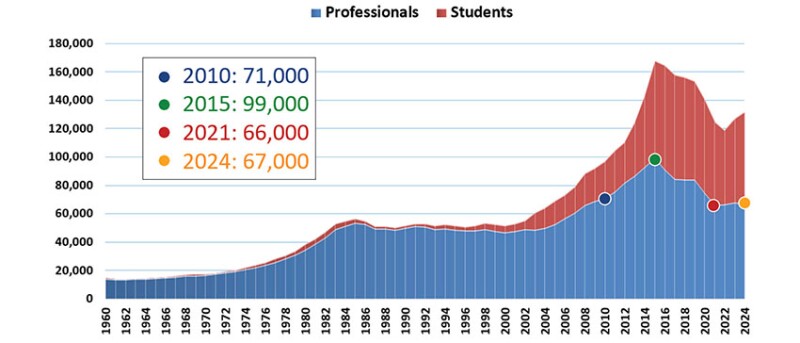
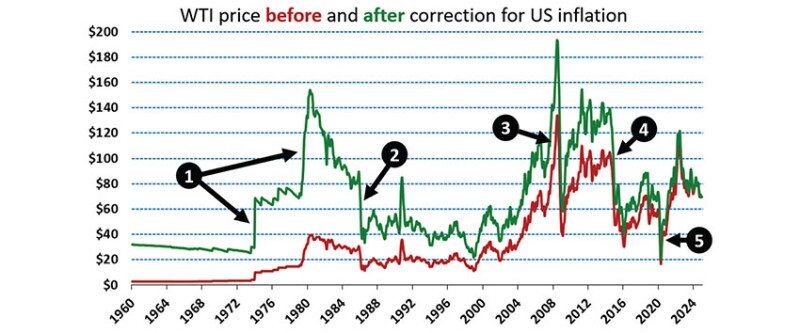
This evolution cannot be separated from the geopolitical context and the fluctuation of crude oil prices, as shown in Fig. 2 (both with and without correcting for inflation in current US dollars). The cyclicity of the oil prices is always noted in such discussions, but we will focus our discussions on the following: (1) the 1970s geopolitical oil crises; (2) the 1985 downturn; (3) the 2008 financial crisis; (4) the 2015 downturn; and (5) the 2020 pandemic.
From 1957 to the First 1985 Downturn
In 1960, SPE professional membership was approximately 14,000, mostly US-based members (we will look at that later). The progressive increase followed the rise of crude oil prices in the context of the geopolitical energy crises of the 1970s. The oil price peaked in 1979 at around $40/bbl, then progressively decreased to $30 until the 1985 downturn (the first of its kind, based on market capture philosophies of NOCs), where oil prices declined to $10. In 1985, SPE membership peaked at 54,000 professionals and remained below this number for more than 20 years.
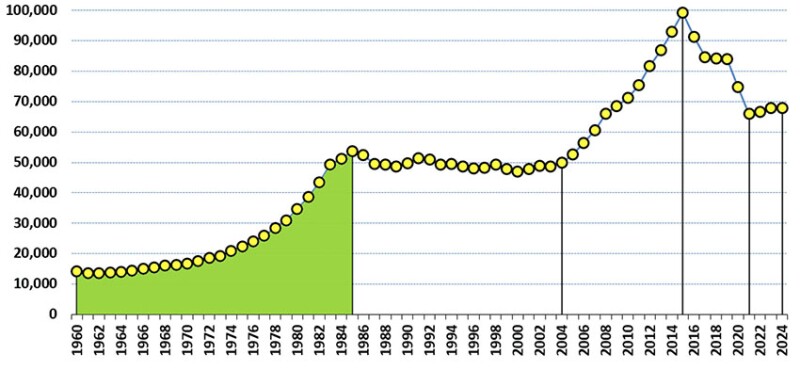
As a note, the relatively stable level of SPE membership during the 1985 downturn suggests that most petroleum professionals maintained their SPE membership while seeking employment.
In the wake of the 1985 downturn, I fault our industry for failing to hire enough YPs for nearly a decade. The impact of this inaction is seen in SPE’s demographics 25 years later, as shown in Fig. 4, which displays the demographic split of members by age groups in 2013. There was a clear “valley” in the 40–44-year-old range, corresponding to engineers who did not enter the industry during the 1985 downturn.
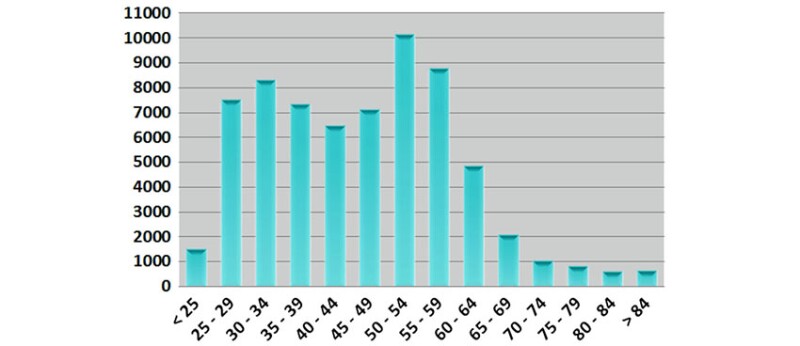
In 2013, I served on the SPE Board of Directors as Technical Director for Reservoir. The concern for SPE and the industry at large had a name: the “big crew change”—the time when the peak of the SPE membership, aged between 50 and 59, would leave the industry and be replaced by significantly fewer, less experienced engineers. From 2000 to 2010, numerous SPE events and discussions focused on the big crew change. Topics such as talent attraction and retention, knowledge retention and management, and mentoring/lifelong learning were major concerns for companies large and small—from operators to service and manufacturing sectors.
From 1986 to 2004—A Global Stagnation, but a Demographic and Power Shift
As shown in Fig. 5, in the nearly 20 years that followed the 1985 downturn, we saw stagnated recovery, cyclic variations in oil prices with small “crises” of limited amplitude, and an essentially stable SPE professional membership of around 50,000. However, this relatively uneventful membership curve does not reflect some of the spectacular changes that took place in our industry and within SPE during the same period.
The “shift of power” from IOCs to NOCs—no comment, everyone witnessed it.
The transfer of technical leadership to service companies. Until the early 1990s, virtually every major IOC would have an R&D center with a full spectrum of technical and logistical talent. This sometimes led to “reinventing the wheel” in isolation and was often not a financially optimized enterprise. But at the time, IOCs were leading the industry in both technology innovation and dissemination. With a few exceptions, almost all R&D centers were abandoned in the 1990s, and the global R&D workload was de facto transferred to service companies (and, to a lesser degree, academia).
The end of technical authority. Analogous to R&D, until the early 1990s, the de facto technical authority in petroleum engineering resided with the IOC R&D centers and their SMEs. While the technical contributions of academics were significant, the IOCs defined the state of the art and determined whether a new technology or method should replace an older one. This “technical authority” role disappeared alongside the decline in IOC investment in R&D. Service companies then took on technical development leadership, and the technical authority was replaced by a commercial contest.
Lastly, and for very different reasons, neither NOCs nor SPE assumed the role of technical authority. SPE could have attempted to take on at least part of this role, but frankly, it was not part of SPE’s mission to impose its view on technical standards. The (only) notable exception to this was reserves classifications via the Petroleum Resource Management System (PRMS), where the protocol evolved in response to the need for an objective, global standard for oil and gas reserves.
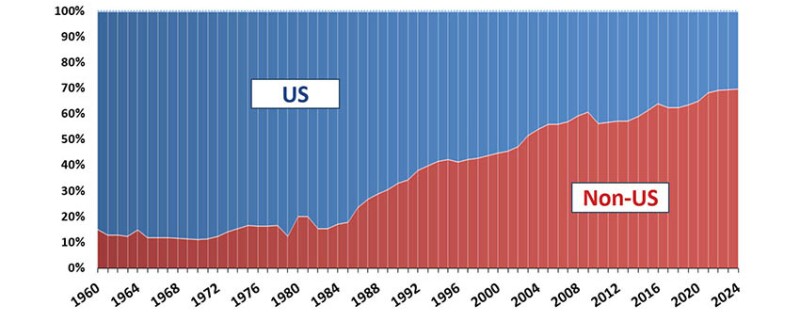
As shown in Fig. 6, after 1985, SPE began its “globalization” shift, moving away from a US-dominated membership to a majority international.
For reference, when SPE began as a separate society in 1957, nearly 90% its membership was US-based. As shown in Fig. 6, the non-US member percentage began to increase in 1985. From 1985 to 2004, the percentage of non-US-based members rose from 18 to 54%, continuing to the present, where this percentage exceeds 70%.
From 2005 to 2015—When the Sky Seemed to be the Limit
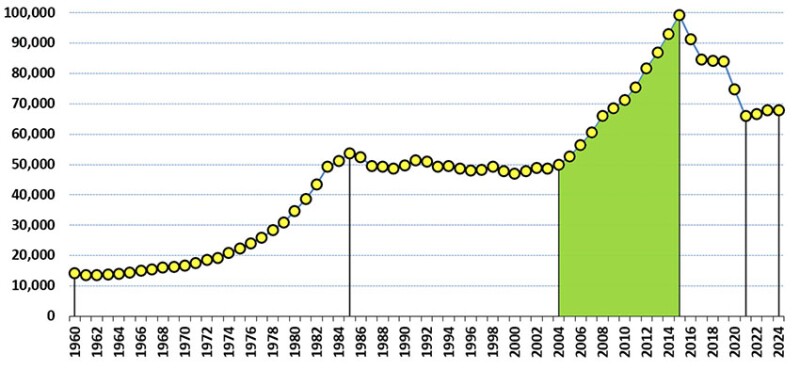
In Fig. 7, the period 2005–2015 is highlighted. Due to the focus on unconventional resources and the associated learning curve, the industry (and SPE membership) grew exceptionally during this period, with an increase of 50,000 members. This growth was similar to the growth SPE experienced in the 1975—1985 period, when SPE saw an increase of 30,000 members. Even the 2008 global financial crisis had no effect on SPE membership growth. In addition to our professional membership doubling from 50,000 to 99,000 members from 2005 to 2015, SPE events, finances, and member programs also increased proportionally with the increase in membership.
In Fig. 8 presents the “health of our membership” demographic plot. The health of SPE can be assessed by comparing the number of professional members by their year of birth vs. date to birth, illustrating the evolution of our age-related membership distributions. While SPE collects detailed information on membership by age, geographic region, etc., these data have only been collected since 2010.
Two caveats: The first pertains to the membership statistics—these data are taken from our members’ profiles. We do not check this member information for accuracy (although we do not expect it to be deliberately erroneous), nor do we require it to be submitted. For example, in 2023, we had 67,900 members but only 53,200 members, or about 80%, actually completed their SPE membership profile. However, this completion rate should not bias our study, assuming it remained constant and statistically balanced across age groups (which we cannot verify).
The second caveat concerns the number of SPE members. Sometimes, we draw conclusions about the number of professionals in our industry based on membership numbers. Such conclusions are fine if our “member assumption” is correct—that the number of members in a given age category reflects the number of relevant active professionals, multiplied by SPE’s “market share” (where market share refers to SPE’s ability to convince these professionals to join and remain members).
Based on Fig. 8, we can make the following observations:
- We confirm the impact of the 1985 downturn with the low number of members born in the mid/late 1960s through the early 1970s, as many in this group never joined the industry.
- We see the “peak” of late baby boomers in members born in 1957–1958, as these members remained in the industry longer, delaying the big crew change and benefitting the industry in terms of talent retention.
- SPE “life members” (those who make a single payment covering 20 years of dues) influence our statistics, as they remain members beyond retirement.
- Lastly, there was a significant increase in members born between 1980 and 1990, correlating with the hiring of young members. This is a textbook example of our industry doing the right thing—emphasizing talent attraction and retention. In addition, companies have also retained senior talent.
From 2015 to 2024—Downturns, Pandemic, Energy Transition, and a New Normal
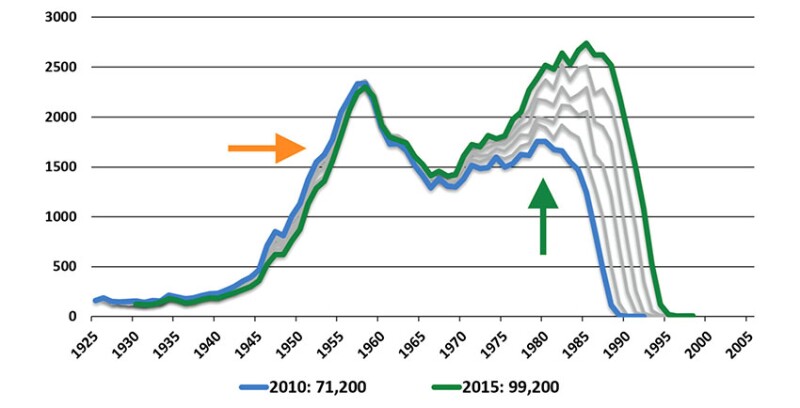
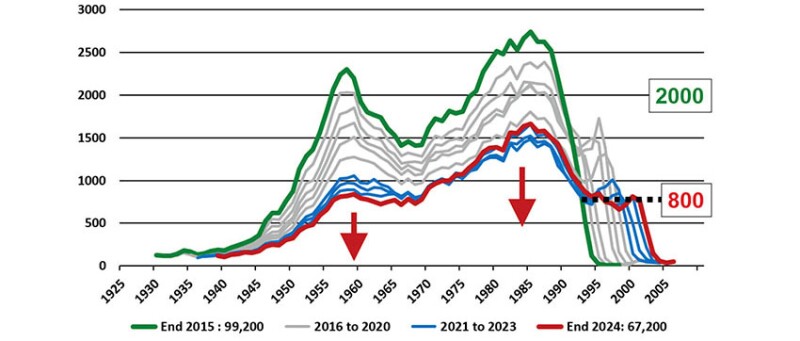
The impact of the 2015 downturn, the pandemic, and the relative stabilization since 2021 (already summarized in Fig. 1) is illustrated again in Fig. 9. Fig. 10 shows the evolution of SPE’s demographics over the same period.
Any concerns in 2014 about losing the late baby boomer generation and their experience were instantly forgotten in 2015 to preserve our stakeholders’ profitability and the survival of some of them. These late baby boomers (my generation) have been and are leaving the industry, some willingly, some not. The demographic “valley” corresponding to members born between 1955 and 1970 has now become a “step.”
In addition, there has been an overall reduction in membership , including among those now in their forties. Many of these people have left the industry for good, although some have returned over the past 3 years.
But, the most concerning issue is the demographic of our youngest members, born between 1995 and 2005. On the right of Fig. 10, we can compare the 2015 demographic curve (green) with that of 2024 (red). In 2024, we will see stabilization at 800 members per year, an all-time low that may represent, depending on the reality behind it, an existential long-term threat. This figure is even far below the 1,500-historical “valley” from the 1985 downturn.
The number of SPE professional members in a given age category is the product of the number of active professionals and the percentage of those who decide to become and remain SPE members. The current low level may result from a sheer reduction in the number of young professionals in the industry, a low appetite to join and remain with SPE, or a combination of both. There is not much we can do about the raw number of professionals in the industry, but we can work to improve our cost/benefit ratio and increase the attractiveness of SPE to them (and their careers). To do this we can start by looking first at our student statistics (Fig. 11).
Looking at Historical Student Member Statistics
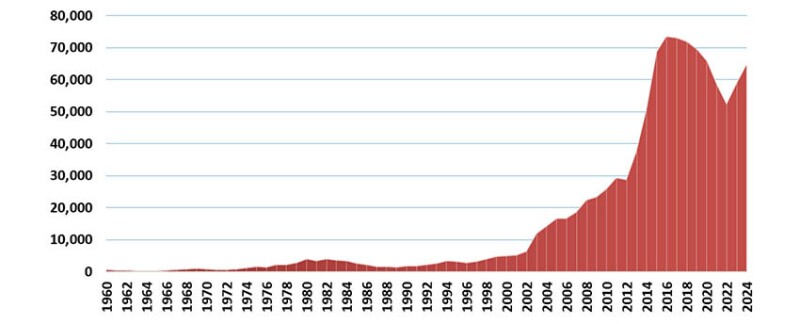
Until 2002, SPE student membership was not free, but was available at a reduced price. As shown in Fig. 11, student membership increased consistently from the 1970s until the 1985 downturn. It reached a minimum in 1990 before recovering to pre-1985 downturn levels in 1994. In 2002, the decision to provide free SPE membership to students led to an exponential increase in the number of student members (perhaps as expected). Student membership reached an all-time high of about 73,000 in 2016, before the effects of the 2015 downturn and the pandemic caused it to drop, bottoming out at about 52,000. Over the past 2 years, we have seen a substantial rebound, with student membership reaching about 64,000.
To put a value on this, providing free student memberships costs SPE $700,000 per year, $150,000 of that amount sponsored annually by Chevron (and previously by Halliburton). One of the tasks on our to-do list is to establish a global sponsorship program to finance 100% of SPE student membership.
From a financial point of view, SPE views free student memberships as a “member value” that we can accommodate. However, we obviously welcome corporate support for programs like this. I must now state the obvious: we subsidize student memberships to entice student engagement and participation, with the hope that it motivates them to “convert” to professional membership once they enter the workforce.
To bridge the gap between when a student leaves academia and joins the industry, SPE provides a free first year of professional membership. However, our retention rates after this first year are significantly less than desired, which means we need to help students see the value of SPE and encourage them to “invest” in SPE by becoming dues-paying members. We must ask ourselves: why does an SPE student member not become a professional member? I will suggest possible reasons:
- The student member does not enter the industry (SPE has no influence on this)
- The young professional does not “see the value” of paying full price for something that used to be free (this is human nature, but someone has to pay).
The SPE Board and I are considering mechanisms and programs to create a transition path from completely free membership (as a student member) to full-cost SPE membership once they are no longer students. The proposals at this point would scale the cost to SPE to just below the current cost of the free student membership program, and it could (and should) convince students to join SPE as professional members while beginning their careers in the industry.
Conclusions
This column is meant to shed light, not curse the darkness. My goal is to identify the realities of our membership statistics over time as we have evolved as a professional society. These statistics clearly show that SPE is relevant to its members’ careers, but we need to translate this relevance into momentum.
I have extracted the conclusions and potential actions that could be taken to achieve the highest levels of member engagement and value. These conclusions and action items are summarized below.
- SPE membership has experienced significant declines due to industry downturns and global events (e.g., the COVID-19 pandemic) with professional membership stabilizing and student membership increasing, but not quite back to pre-pandemic levels.
- In simple words, our current demographic challenge lies in the low retention and transition of students to YPs. This implies a long-term decay in SPE’s professional membership, which in turn poses a threat to SPE’s sustainability.
- Historical patterns indicate that downturns create demographic gaps, emphasizing the need to retain and attract members at all career stages.
- Free student memberships have driven student engagement for over 20 years, but they have not translated into sustained professional memberships.
Actions Items
- SPE must develop a structured transition program from student to professional membership to encourage retention and engagement.
- SPE should work to establish corporate sponsorship initiatives to support student memberships and help ease the financial burden on the organization.
- SPE must implement targeted outreach programs focused on YPs to highlight the long-term career value of SPE membership. While we have done this very well historically, as shown by the “tail” in Fig. 10, the YP demographic is now both an urgent and a critical issue.
- SPE must reevaluate its membership pricing models to create a more gradual and affordable transition from free student memberships to full-price professional memberships.
- SPE must increase the visibility of its role in career development to attract and retain members through enhanced communication and engagement strategies.
I thank you for joining me this month and look forward to seeing you again next month. While I won’t promise anything, I will do my best to keep future columns at a more palatable length.
I was “hired” as your 2025 SPE President to align resources and value for SPE, and I always welcome your input, whether it’s critical, neutral, or complimentary. Feel free to email me at president@spe.org.
Visit my SPE Connect channel, “President JPT Column–Discussion Page,” to share your thoughts and insights.
Reflections on the 1985 Downturn: Career Shifts and the Unlikely Opportunities of Crisis
However, the 1985 downturn and subsequent years were a very real shock to our profession. For young engineers, it may be hard to imagine that, until this time, the career model was to hold a job with a single employer for the entirety of one’s career. I recall well my 1982 interview with Shell in The Hague, where potential career paths were described, with the expectation that, if you joined Shell, you would retire from Shell after 30-plus years on the job. (I joined Flopetrol-Schlumberger, and was immediately trained and sent to reasonably harsh jobs in the Middle East and the North Sea.)
This was a time when technical careers and management careers were considered equivalent choices. This “equity” exploded with the 1985 downturn and vanished completely in the following 10 or so years. In my opinion, this discrepancy between management and technical roles can (at least partly) explain the decisions made by our stakeholders during the crises that followed.
In the subsequent industry cycles (up until, but not including 2015), it even became a sort of game—some of my industry colleagues would happily accept a redundancy package, wait a few months, and then be hired at a higher salary—sometimes by the same company.
As an aside, when times are tough, as you may be experiencing now, you may be told that crises are times of both challenges and opportunities—citing a Chinese proverb which, apparently (if you believe the internet), is not about this at all. You may be tempted to shrug this off as a weak, self‑fulfilling argument.
But I beg to differ. In 1987, following the 1985 downturn, I used the funds from my severance package to start my company in a closet, alongside a former Flopetrol colleague. Everyone (including us) believed that it was the worst possible time to start a company, and in retrospect, it was absolutely the best time. The 1985 downturn shaped my response to everything that followed, including the fact that I am now writing this column. Crises do, indeed, come with opportunities. To be honest, I was 28 in 1987, and I must confess that I had strong doubts about that Chinese proverb.
The effect of the downturn was challenging to professionals and catastrophic for students. Many abandoned their petroleum studies, while some—though not enough—chose the (wise) option of extending their studies to pursue a master’s degree or PhD until the dust settled.