During the last 20 years, diagnostic fracture injection tests (DFITs) have evolved into commonly used techniques that can provide valuable information about reservoirs and hydraulic-fracture-treatment parameters. Thousands of tests are run every year in both conventional and unconventional reservoirs. However, many factors associated with data collection and analysis can result in poor or incorrect results. This paper attempts to describe some of the common problems and to help prevent some common errors often observed in DFIT execution and analysis.
Introduction
DFITs are small pump-in treatments performed to gather data to help design follow-up hydraulic-fracturing treatments and characterize a reservoir.
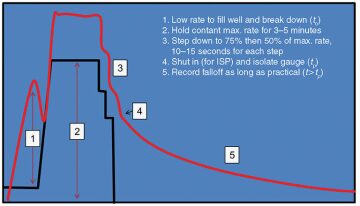
A generic DFIT is shown in Fig. 1. The wellbore is first filled at a low to moderate rate until a positive surface pressure response is observed. With low-to-moderate wellbore compressibility, the pressure should rise quickly until initial breakdown occurs. Breakdown will be indicated either by a sharp drop in pressure as a new fracture initiates (as at Number 1 in Fig. 1) or by a plateau in pressure as existing fractures are opened and extended. Once a breakdown event is observed, the injection rate should be increased to the maximum rate allowed by available horsepower or to 75% of the planned treatment rate of the main fracture treatment, whichever is achievable. A constant rate is then held for 3–5 minutes (Number 2 in Fig. 1), after which a rapid step-down can be conducted. The step-down test is separate from the actual DFIT but is commonly run at the end of the pump-in to determine perforation and near-wellbore frictional pressure losses. The rate is then immediately reduced to zero to obtain the instantaneous shut-in pressure (ISIP), shown as Number 4, and the falloff pressure is monitored for as long as possible or as long as necessary to acquire the desired data. Even when high friction is not expected, the step-down is recommended to make identification of ISIP easier.

Common Acquisition Issues
A Newtonian, nonwall-building fluid must be used when pumping the treatment if any reservoir properties are to be obtained from the analysis. Using gelled or other non-Newtonian fluids can disrupt the after-closure pressure gradient and mask the reservoir flow capacity. Another common issue that is also a holdover from old-style mini-fracture treatments is the use of multiple pump-ins. DFITs should be considered as “one and done.” If the treatment is not pumped correctly the first time, a second attempt is almost pointless because the reservoir conditions have been altered by the first injection and, in low-permeability systems, the created pressure transients will not have dissipated by the time the second attempt is usually made.
Not acquiring falloff data for a long enough period is also a common acquisition issue.
Additional field operational issues that can cause acquisition problems are frozen or temperature-affected wellheads and offset reservoir interruptions. Precautions should be taken for wells in winter conditions to prevent freezing of the surface gauges. Even if the gauges do not fully freeze, temperature fluctuations can affect the pressure readings; therefore, insulating the wellheads during the falloff periods is often helpful to prevent these pressure movements.
Common Analysis Mistakes
Incorrect ISIP Determination. Analysis of a pressure falloff begins with determination of the ISIP. This value is taken to represent the fracture-extension pressure, when corrected to bottomhole conditions, and the fracture-extension gradient. The difference between the ISIP and determined closure pressure is taken as the net pressure in the fracture or as a measure of the resistance of the rock to fracture extension, or process-zone stress. Because net pressure determines fracture width and, to a large degree, height (because of the expectation that confining-stress contrast controls containment), the accurate determination of ISIP is critical to any later analysis and fracture-geometry modeling.
In many cases, the ISIP is not obvious and does not occur immediately after shut-in. When a substantial near-well pressure drop exists—either through poor perforation efficiency or, more commonly, high near-wellbore tortuosity—injection at the fracture entrance may not stop for some time after the surface injection stops. The amount of continued injection after shut-in, the amount of excess frictional pressure that must dissipate, and the time required for decompression of the wellbore fluids depend on the severity of the near-well restriction to flow and the compressibility of the wellbore volume.
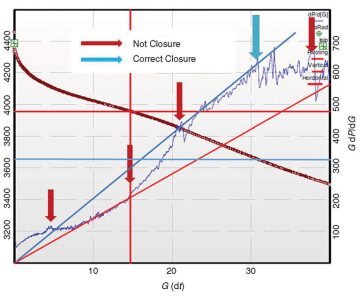
Basic Selection of Closure. Basic DFIT analysis should be covered in sufficient detail in earlier works, but some mistakes in the most basic interpretation of the G-function diagnostic semilog derivative continue to be made by many analysts. Fig. 2 shows a DFIT with variable fracture compliance, or storage during closure, where the closure time and pressure have been diagnosed mistakenly. In the original analysis, the closure time and pressure were identified by the positions of the red lines at a closure time of G=14 and P=3,960 psi. The correct closure time is G=32 and P=3,640 psi. This discrepancy will obviously affect any interpretation of closure stress for calibration of a geomechanical model or stress profile and will affect estimates of formation flow capacity and post-fracture production. The red arrows in Fig. 2 indicate other incorrect closure events that are often selected by mistake. The one correct closure event is shown by the blue arrow, after the end of the variable compliance and linear closure periods. The error in closure stress also leads to an error in the interpretation of fracture net extension pressure. This affects the predicted width of the fracture and, therefore, directly affects the computed fracture length through conservation of injected volume. Predicted fracture height may also be affected, depending on the strength and stress of the confining layers. In short, if the wrong analysis results are applied to the calibration of any fracture-design model, the results will be incorrect.

Effect of Injection Time Vs. Pump Rate. For a DFIT to be valid, an injection rate must be selected that will generate a net pressure and fracture geometry that are representative of the main fracture treatment. In practical terms, that means that the highest possible injection rate for the test will lead to the most-representative results. Once a stable net pressure and fracture geometry are achieved, a higher injection rate will cause the fracture to grow faster but should not alter the width or height significantly. This assumption deviates from the classical Perkins-Kern-Nordgren geometry assumptions wherein all net pressure is generated solely through the frictional pressure gradient of the moving fluid. More-realistic analysis of DFIT results requires that there be some resistance to fracture propagation inherent in the rock. A very low injection rate will develop smaller net pressure, therefore smaller fracture height and width, and will not strain the rock to its ultimate limit. This can result in missing the evolution of secondary shear fractures that can affect compliance, leakoff rate, and system permeability. The original theoretical models assumed the rock to be linearly elastic and homogeneous, with no consideration that shear failure could exist.
Design of Test Duration. Longer pumping times allow more time for penetration of the induced pressure transient. Given a stable fracture geometry, the time required to close the fracture by leaking off a fixed volume/surface-area ratio of fluid in the fracture can be related to the system permeability.
For a 5-minute injection period into a 0.1-md formation, fracture closure occurs in approximately 0.2 hours (12 minutes). In these moderately-high-permeability formations, where this technique was first applied, extending the pumping time may not be a serious concern. For this 0.1-md rock, a pump time of 20 minutes will still reach fracture closure in approximately 1 hour of shut-in time.
At 0.01 md, the 5-minute pumping time requires 2–3 hours to reach closure. For a 0.001-md formation, which is not atypical for what are considered commercial tight silt or shale reservoirs, closure can take up to 24 hours after a 5-minute injection. If the system permeability is actually in the 100-nd range, closure can take up to 10 days following a 5-minute injection. When system permeability is this low, the created-fracture length will be large and the pressure transient established at closure will remain in a pseudolinear-flow regime for a very long time.
Once the fracture has closed, some time is required for a stable reservoir transient flow regime to be established. On a log-log plot of pressure change vs. shut-in time, a safe and realistic lag time is one-half of a log cycle in time after closure. That roughly means that no data should be analyzed for any reservoir flow regime, including pseudolinear flow, until three times the closure time has elapsed. So, in the 0.01-md, 5-minute injection case, allow 2–3 hours for closure and 6–9 hours after shut-in for the start of a valid reservoir flow regime. For the 0.001-md case, that is 24 hours to closure and 3 days of shut-in for any useful reservoir information.
Phase Segregation and Gas Entry. During the falloff period, while the well is sitting undisturbed, gas entry from the formation can occur. For the ideal case of a sealed wellbore under isothermal conditions, the volume of the gas bubble remains constant as it rises. With no mass transfer from the gas to the wellbore fluid, the moles of gas in the bubble remain constant; therefore, the bubble pressure remains constant as it rises. If a single gas bubble floats from the perforations to the surface under these conditions, the surface pressure will rise to the original bottomhole pressure and the pressure at the perforations will double. In reality, leakoff from the well is not identically zero, the increased pressure generated by the rising bubble causes an increase in leakoff rate, the gas temperature decreases somewhat during transit, and some gas may dissolve in the wellbore fluid; therefore, a very small gas bubble entering at the perforations can cause a large pressure upset.
Loss of Hydrostatic Head. The loss of the hydrostatic head effectively terminates a DFIT. Bottomhole gauges can be and are installed to acquire data in certain circumstances; however, these will not aid in extending the test if the hydrostatic column starts to fall. In these cases, the bottomhole gauge will record the weight of the fluid standing above the gauge. The fluid column is supported by a partial vacuum between the fluid level in the well and the sealed wellhead. The rate of fluid-level fall is then controlled more by the rate of vaporization of the wellbore fluid than by the reservoir transmissibility.
This article, written by Special Publications Editor Adam Wilson, contains highlights of paper SPE 169539, “Diagnostic Fracture Injection Tests: Common Mistakes, Misfires, and Misdiagnoses,” by R.D. Barree, SPE, J.L. Miskimins, SPE, and J.V. Gilbert, SPE, Barree & Associates, prepared for the 2014 SPE Western North American and Rocky Mountain Joint Regional Meeting, Denver, 16–18 April. The paper has not been peer reviewed.

