Shearing of production fluids creates tight oil/water emulsions, including small droplets of oil in water and small droplets of water in oil. The greater the shearing, the smaller the droplets, and the more difficult the subsequent process of separating the oil from the water. Small droplets rise very slowly and are often not adequately separated in a given residence time. This can overwhelm downstream equipment unless additional steps are taken such as increasing chemical dosage, adding or increasing heat, or removal of the emulsion for separate treatment—all of which will increase operating and capital expenses.
For our purposes, we consider only the removal of oil from water in a water treatment system. Removal of water from oil, as in oil dehydration, will be discussed elsewhere. The four objectives of the article are
- To provide simple formulas that can be used to recognize when shearing is likely to be a significant problem.
- To provide formulas that help determine if mild turbulence is likely to mitigate upstream shearing.
- To give practical advice on how to reduce shear in pumps and valves and how to mitigate the effect of shear.
- To introduce the turbulent energy dissipation rate, ε, as a measure of turbulent shearing, and to provide formulas that allow the calculation of maximum droplet size as a function of ε.
The article is simply a review of basic droplet formation due to shearing from pipes, valves, and pumps. It is intended to remind engineers that the decisions made upstream can have a grave consequence on downstream separation equipment performance. The article focuses mostly on the sources of shear, the relative magnitude of shear, and the consequence on the oil droplet size.
Details regarding oil droplet size distribution is outside the scope of this article. Instead, the focus is on just one parameter of the droplet diameter distribution, the maximum droplet diameter. This greatly simplifies the discussion without loss of impact.
Also, the effect of smaller oil droplets on water treatment equipment is not discussed in detail. That effect varies depending on the type of equipment, be it gravity settling, a hydrocyclone, or a flotation unit. Suffice to say that the smaller the droplet diameter, the poorer the separation efficiency and the poorer the treated effluent water quality.
Sources of shear. There are many sources of shear. Fluids are initially subjected to shear in the reservoir, near the wellbore, where pressure drops and the narrowing radius of the flow creates an acceleration of fluid. Lifting techniques, if they are used, such as electrical submersible pumps, create turbulence to varying degrees. The wellhead choke is another, sometimes intense, source of shear. The list goes on and includes the control valves and pumps used in the facility itself.
Mild vs. intense turbulence. While high-intensity turbulence, as caused by valves and pumps, gives rise to smaller droplets, mild turbulence can have the opposite effect. In pipelines and flowlines, mild turbulence promotes drop-drop coalescence and actually leads to an increase in the average droplet size. It is important, therefore, to take into account the effect of turbulence in design and troubleshooting. In the case of high shear, it may be necessary to reduce shear by selection of appropriate equipment, or it may be necessary to reduce the sensitivity of the fluids to shear by adding a chemical treatment. It is important in design and in troubleshooting to have at least a rough estimate of which turbulent regime (coalescing vs. shearing) will be induced by various selected pieces of equipment.
Turbulence makes oil and gas unique. Turbulence and the shearing of oil droplets is one of the features of oilfield water treatment that distinguishes it from other industrial water treatment applications. Upstream oil and gas commonly involves high-pressure fluids coming into a facility, and low-pressure treated produced water leaving the facility. The pressure cascade which is used to separate gas from oil and to condition the oil to its target vapor pressure inevitably results in intense shearing of fluids through valves. In addition, recovery of oil separated from produced water usually involves pumps for the recycling of oily water. Many other industrial water treatment applications, such as pulp and paper or food and beverage, involve contaminants such as oil, grease, sticky tar-like materials, suspended polymer, and oily or polymer-coated solids particles. But oilfield water treatment is unique in that it involves all of those difficult contaminants with the added complication of shearing.
The inevitability of shear. To some extent, shear is an inevitable consequence of processing conditions. Fluid pressure and flow rate must be controlled through a facility in order to achieve the objectives of the facility including
- gas conditioning (dewpoint, water content)
- oil conditioning (vapor pressure, water content)
- oil and gas pumping, if required, for export
- water treatment for disposal or reuse (remove oil and solids)
Almost all facilities make use of the so-called pressure cascade in order to achieve these objectives. Flow splitting between parallel trains with upstream valves is another problem area. While a certain degree of shearing is an inevitable consequence of the economical development of hydrocarbons, there are some things that can be done to minimize the effect of shear and to maximize the size of oil drops.
Turbulence is not so complicated at small sizes. Within the broad subject of turbulence, only a small fraction of investigations have dealt with turbulent shearing of oil droplets in water. It is a specialized application within turbulence, which is itself a very complex subject. However, one of the features that helps to simplify this complex subject is the fact that for small suspended droplets, only the small eddies are important. Small oil droplets, on the order of 1 to 50 micron diameter, which are the greatest challenge in oilfield water treatment, are mostly influenced by collision with eddies of roughly the same size. It turns out that the kinetic energy of these small eddies is relatively independent of how the turbulence is generated. The value of the kinetic energy is important, to be sure. But whether that turbulent kinetic energy is generated in a pipe, pump, or valve does not matter. The kinetic energy of the small eddies only depends on a single parameter regardless of all other features of the flow, the turbulent energy dissipation rate (ε), which is a measure of the intensity of the turbulence.
Once the turbulent energy dissipation has been calculated, it can be used to predict a number of properties of the small eddies. The eddy collision frequency, energy of those collisions, and the drop-drop collision frequency can be calculated using simple formulas that depend on the turbulent energy dissipation rate. On a small scale, for a given value of turbulent energy dissipation rate, the turbulence generated in any of these devices (pipe, pump, or valve) looks the same. Excellent models exist for the breakage of droplets as a function of this parameter. Thus, it turns out that small-scale turbulence is actually rather straightforward.
Bernoulli equation. As might be expected, the Bernoulli energy equation can be used to derive practical equations for calculating the turbulent energy dissipation rate. The Bernoulli equation is written here with subscript (1) indicating the upstream location, and subscript (2) indicating the downstream location. What this equation says is that, along a fluid streamline, energy is conserved as the fluid flows from location (1) to location (2). Any conversion of mechanical energy into heat is accounted for by the energy dissipation term (h), which is explained more completely later.

(1)
where
r = density of the fluid (kg/m3)
P1 = pressure at upstream location (N/m2)
P2 = pressure at downstream location (N/m2)
u1 = superficial velocity of the fluid at the upstream location (m/s)
u2 = superficial velocity of the fluid at the downstream location (m/s)
z1, z2 = elevation of fluid relative to reference points upstream and downstream (m)
h = energy dissipation due to viscous dissipation from point (1) to point (2) (J/kg)
g = acceleration due to gravity (9.81 m/s2)
Units of energy per unit mass. Each term of the equation has units of Nm/kg, which are equal to J/kg (energy per unit mass of fluid). From the standpoint of shearing of oil droplets, the interesting term is h, the energy dissipation due to fluid friction (aka viscous dissipation). For flow through a pipe, elbow, or a pump, energy dissipation is mostly due to turbulence. In reality the energy is not lost, it is converted from mechanical energy into thermal energy. The magnitude of this energy conversion can be significant from the standpoint of shearing of oil droplets, or even in terms of pressure drop in some cases. However, from the standpoint of temperature rise, it is rather small, due to the high heat capacity of most liquids.
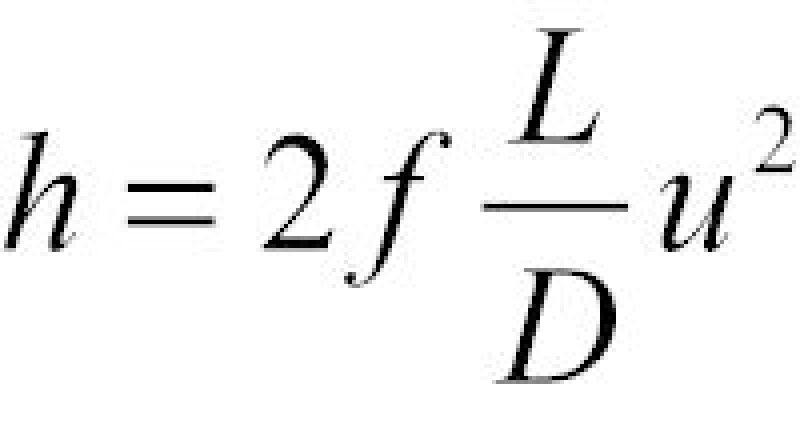
Energy dissipation. The typical equation that is used to estimate the energy dissipation (h) in turbulent pipe flow is given by
(2)
where
L = length of pipe segment between points 1 and 2 (m)
u = superficial velocity ( m/s; u=Q/A, where Q is the volumetric flow rate, and A is the cross-sectional area of the pipe)
D =pipe diameter (m)
f =Fanning friction factor (dimensionless)
This is a well-known empirical relationship. The friction factor depends on the Reynolds number of the flow. It can be calculated for straight pipe, elbows, and T-junctions. It is discussed in more detail later. The units of energy dissipation (h) are m2/s2, which is equivalent to energy per unit mass (J/kg), as expected. In the next section, the turbulent energy dissipation rate is discussed, which has the units of W/kg, which is equivalent to
J/kg⋅s, or m2/s3.
Most readers will realize that the energy dissipation term (h, aka friction loss) in Bernoulli’s equation (Eq. 1) encompasses all energy losses (straight pipe, elbows, valves, etc.) and for that matter energy inputs due to work done from, say, pumps. Equation 2 allows the calculation of h for only a couple of these cases. One case of interest here is that of a dispersion of oil droplets in water at moderate oil concentrations (<1%). Another case, of less interest, is that of a single phase fluid. The same equation can, to a very good approximation, be applied in both cases. Essentially the same energy dissipation will occur for a given set of turbulent flow conditions, whether the oil is present or not, for moderate oil concentrations. From the standpoint of the fluid, very little energy goes into oil droplet breakage. From the standpoint of the oil droplets, the energy is intense. Almost all of the energy goes into viscous dissipation—thermal energy. Thus an equation written for the case of a single phase fluid (Eq. 2) can be applied to the case of interest here (oil droplets dispersed in water).
Energy dissipation vs. energy dissipation rate. As discussed above, the turbulent energy dissipation rate is the rate of energy loss due to fluid friction. If the location of points (1) and (2) are chosen such that the flow is relatively similar in terms of flow rate, diameter, and turbulence intensity, then the situation is relatively easy to analyze. The rate of energy loss is given by h/t, where t is the time required for the fluid to traverse from point (1) to point (2). A simple way to calculate this time is given by t=L/u, where L is the length of pipe between point (1) and point (2); and u is the superficial velocity (u=Q/A). Substituting these quantities into the equation for the rate of energy dissipation gives

(3)
where
e =turbulent energy dissipation rate (m2/s3 or W/kg)
h/t =rate of energy dissipation due to fluid friction (W/kg)
This equation will be used later to calculate values of energy dissipation rate. The units are energy per unit mass per unit time: W/kg (J/kg⋅s). Physically, these units are power per unit mass. The units highlight an important aspect of this equation. The quantity of interest is not a measure of energy. The quantity of interest is the turbulent energy dissipation “rate.” It is the rate at which fluid turbulence dissipates energy that is important in oil droplet shearing. The greater the rate of energy dissipation, the smaller the oil droplets as a result of shear.
It is also of note that turbulent energy dissipation will occur whether the fluid is single phase (e.g., pure water), or a dispersion of oil droplets in water, or multiphase (gas, oil, and water). The calculation of ε will vary in these situations. The particularly simple case of a dispersion of oil droplets in water was chosen for the illustrative example given above.
In the case of oil droplets dispersed in water, not all of the turbulent energy goes into breaking up the droplets. Almost all of the turbulent energy is dissipated in the form of heat. The mechanism for this dissipation is the fluid friction experienced by the eddies. This fluid friction occurs over all sizes of eddies but the greatest dissipation rate occurs at the small-scale eddies. These small-scale eddies also happen to smash into the oil droplets and break them into smaller droplets. This is the process modeled here. But for moderate concentrations of oil in water this process has a negligible effect on the rate of energy dissipation.
Illustrative calculations. Equation 3 can be used to calculate values for the energy dissipation rate for pipe flow, and the values calculated for straight pipe are plotted in Fig. 1. A range of flow rates has been used. Two pipe diameters were selected, 4 in. and 6 in. The Fanning friction factor (f) was estimated as 0.01. A single value of the Fanning friction factor was used. (For more rigorous calculations, the Fanning friction factor should be calculated as a function of the Reynolds number. For our purposes here, this level of detail is considered unnecessary. Using metric units makes the calculations easy.) A fluid flow rate of 3 m/s corresponds to 13,200 BWPD for a 4-in. (0.1 m) diameter pipe. Substituting these values into Eq. 3 gives: 2×0.01×33/0.1=5.4 W/kg. This is the value in the figure (red line).
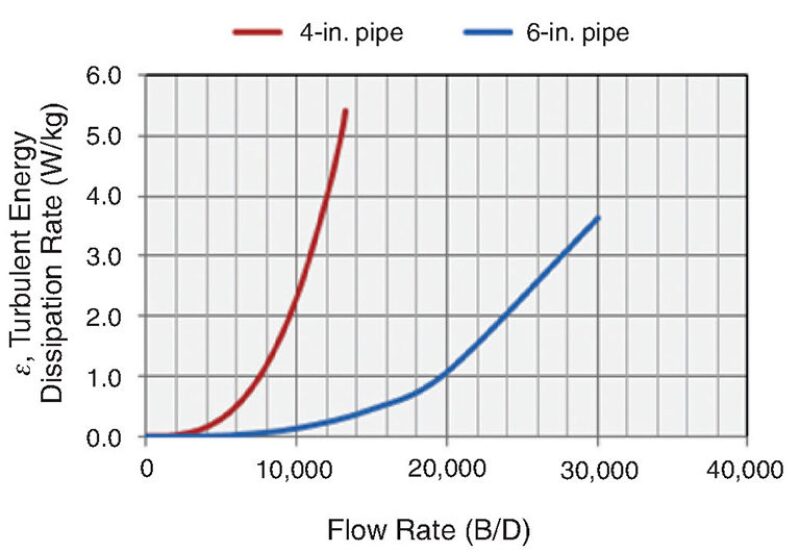
Order of magnitude. As shown by these calculations, the magnitude of energy dissipation rate is between 1 W/kg and 10 W/kg for straight pipe flow. As will be demonstrated later, these values are low compared to those for flow through a valve or pump. In fact, it will be shown that these values do not cause droplet breakup. Instead, this level of mild turbulence intensity actually enhances coalescence. This is the basis of the SP-Pack device invented by Ken Arnold (1991).
Reynolds number. It is worthwhile to point out the difference between the energy dissipation rate (ε) and the Reynolds number (NRE). For many engineers, Reynolds number is the quantity that comes to mind in relation to fluid turbulence. The Reynolds number provides a criterion for the transition from laminar to turbulent flow. That transition is governed by the ratio of convective force to viscous resistance. The higher the Reynolds number, the more intense the turbulence. But the Reynolds number does not provide a useful relation between turbulence intensity and eddy characteristics. The difference between the Reynolds number and the turbulent energy dissipation rate is analogous to the difference between a momentum balance (Navier-Stokes equation, i.e., NRE) and an energy balance (Bernoulli equation, i.e., ε).
As shown in Fig. 1, the energy dissipation rate increases by a factor of approximately 15 in going from a 6-in. to a 4-in. diameter pipe at a fixed volumetric flow rate. The Reynolds number only increases by a factor of 3/2 for the same change in pipe diameter at fixed volumetric flow rate. The fluid energy has increased much more than the fluid momentum.
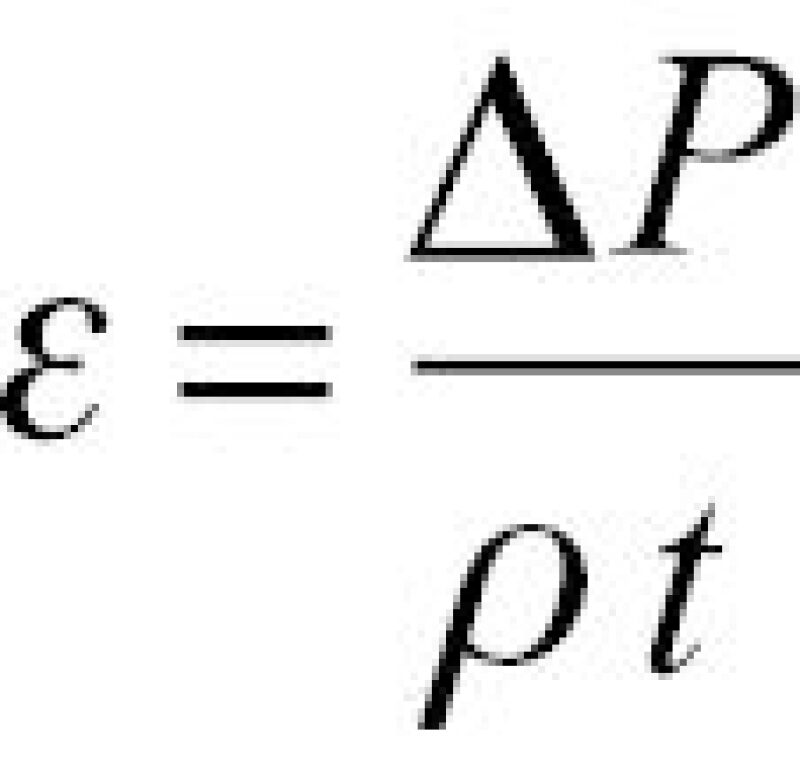
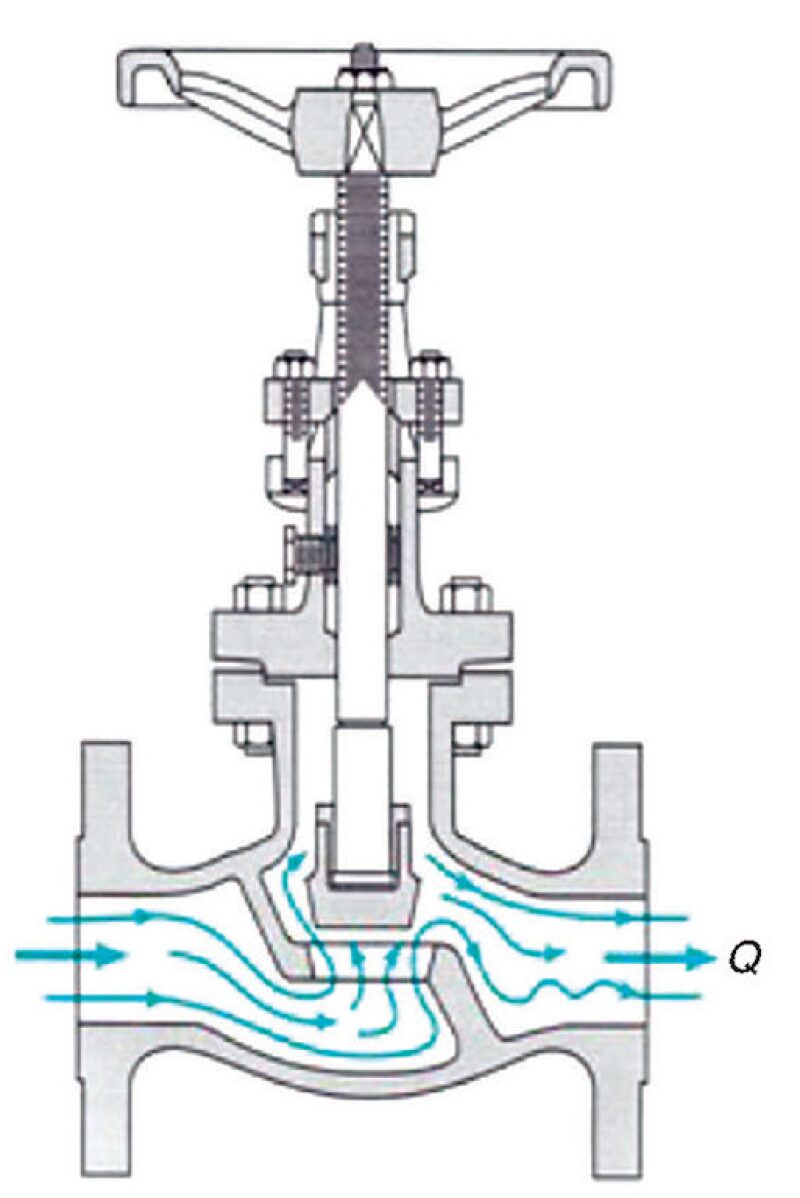
Pressure drop through a valve. Returning to Bernoulli’s equation, a useful formula can be derived that can be used to estimate the energy dissipation rate for flow through a valve. Assuming that the height of the fluid going into the valve equals that coming out of the valve, i.e., z1=z2, and assuming that the superficial velocity is the same going in and coming out, i.e., u1=u2, this leaves only the terms involving the pressure drop (P1-P2), and the energy loss (h). The energy loss per unit time is then given by
(4)
where
t =time that the fluid experiences intense turbulence (s)
From inspection of Eq. 4, the following conclusions can be drawn. The greater the pressure drop per unit time, the smaller the maximum droplet size that will be generated. Thus a pressure drop experienced over a short time (e.g., through a control valve) will generate a smaller droplet size than the same pressure drop experienced over a longer time (e.g., pipeline). Also, a key point is that the pressure profile goes through a minimum which is followed by pressure recovery. If the depth of this minimum can be reduced by clever valve design, then shearing of oil droplets can be reduced as well (see below). Eq. 4 can be used to calculate the energy dissipation but that will not be done here.
In much of the quantitative equipment design work the turbulent energy dissipation rate is calculated using computational fluid dynamics (CFD). When CFD is used, it is customary to calculate the entire droplet diameter distribution. In order to do this, additional models are required for the coalescence rate (Liao and Lucas 2010) and droplet breakage function (Liao and Lucas 2009). Also, it is customary to use a Population Balance Model within the CFD code in order to ensure that the mass of the oil droplets is conserved through the process. Without going into further details, there are some subtle nuances that need to be considered in order to obtain accurate results. The literature is very good and quite readable (van der Zande 2000 and van der Zande et al. 1998).
Maximum droplet size. Whether or not the shear rate is sufficient to break the drops depends on the interaction between two stresses (force per unit area). One of these stresses is external to the drop and is due to turbulence as just described. The other stress occurs at the oil/water interface. The interfacial stress due to interfacial tension acts to restore the spherical shape of the drop and minimize the interfacial area. If the shear rate across the drop due to turbulence is sufficiently high to overcome the interfacial restorative stress, the drop will break apart. Thus, for a given shear, there will be a maximum droplet size, which is related to the relative strength of turbulent shearing forces (characterized by ε), and internal droplet forces characterized by interfacial tension (σ). The ratio of stress caused by turbulence to restorative stress due to surface tension is known as the Weber number.
Maximum droplet diameter vs. shear intensity. The process described above was first quantified in mathematical form by Hinze (1955), and subsequently improved (Davies 1985). As a point of interest, Hinze was a pioneer in the field of turbulence. He started his career at an oil company where he developed his ideas about droplet shearing. Fig. 3 gives the result of his model and shows the range of turbulent energy dissipation rate associated with straight pipe, high-shear centrifugal pumps, and valves.
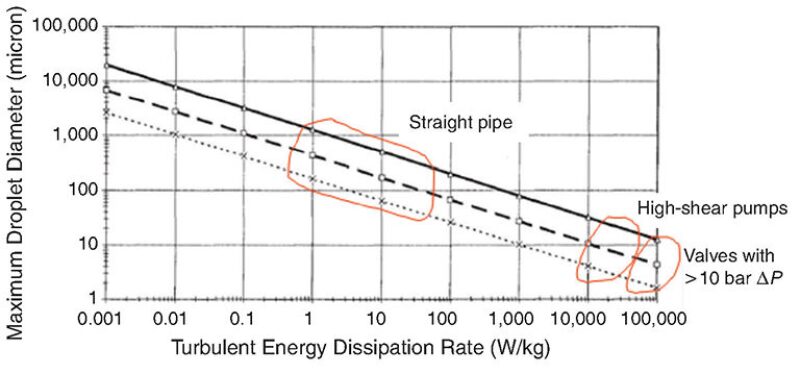
The equation for these curves is

(5)
where
dmax =maximum droplet diameter (m)
s =interfacial tension between the oil and water phases (N/m)
In the above equation, the units for interfacial tension are N/m. In Fig. 3, the units are mN/m (milliNewton per meter), which is equivalent to the more familiar units of dyne/cm. In the original Hinze paper (1955), the model was compared to experimental data. Good agreement was found for a light (low-viscosity) oil in water. It is important to point out that the Hinze model does not take into account the viscosity of the oil phase, nor the concentration of the oil phase (oil cut). Subsequent work on these models do account for these interactions (Davies 1985). Also, the Hinze model, and other models for the maximum droplet size, do not take into account drop-drop coalescence, which generally occurs immediately downstream of any intense region of turbulence.
Drop size as a function of interfacial tension. As shown in Fig. 3, the drop size resulting from shear is a strong function of interfacial tension. Low interfacial tension results in small drops. In typical oil/water systems, low interfacial tension can be the result of the following factors:
- naturally occurring polar molecules in the produced fluids that migrate to the interface
- excessive use of production chemicals such as corrosion inhibitor and/or low dose hydrate inhibitor
Both of these classes of surface active chemicals have a similar effect. They both reduce the interfacial tension, thus making oil droplets more sensitive to shear. Also, the presence of these molecules at the oil/water interface creates an energy barrier to coalescence. Thus, once the small droplets are formed, they remain stable and generally lead to water quality problems. Most applications of production chemicals do not lead to drastic water treatment problems. However, in some cases where asset integrity or flow assurance would otherwise be in jeopardy, high doses of production chemicals are the saving grace for the facility.
Pumps. In 1988, Flannigan et al. published measured oil droplet size for a number of different types of pumps over a range of differential head. The results of these measurements are given in Fig. 4. All of the pumps were fed the same or similar oil/water emulsion, and were operated at the same flow rate over a range of differential head.
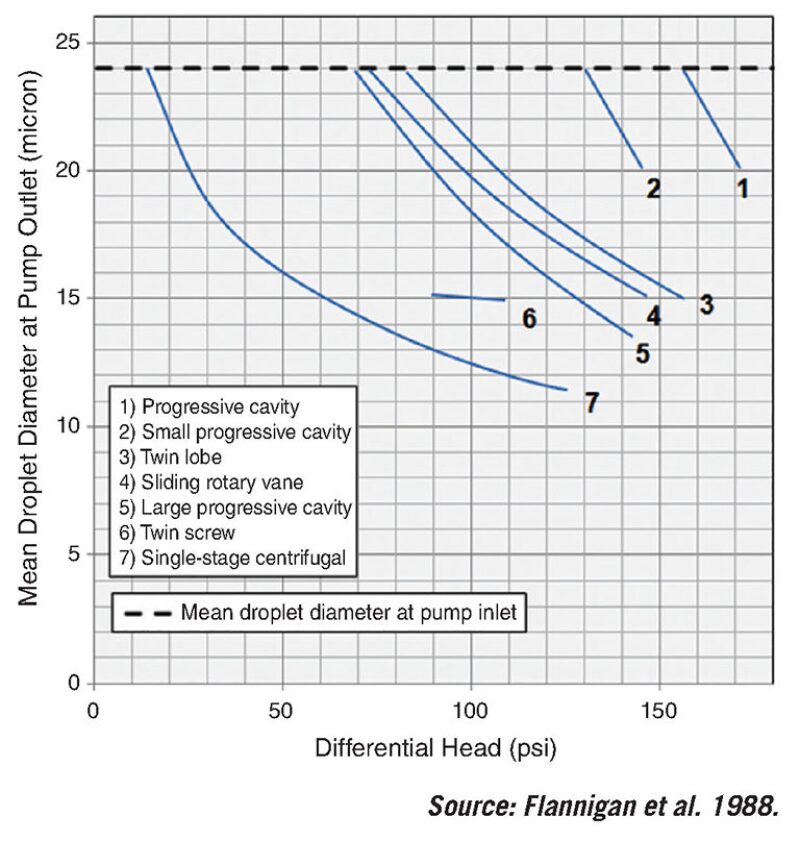
Centrifugal pumps are by far the most widely used type of pump in upstream oil and gas facilities. From a water treating perspective they have benefits and drawbacks. The cost of a centrifugal pump, compared to that of most positive displacement pumps is an obvious attraction. Also, for produced water service, reliability of positive displacement pumps is not necessarily a drawback but does depend on the details of the design (see www.nov.com/waterwolf for a successful design). Ditria and Hoyack (1994) summarized the situation at that time by saying that centrifugal pumps are not normally thought of as low-shear pumps; however, due to their simplicity, reliability, and relatively low cost, they are more appropriate than positive displacement pumps for some applications. Shearing can be reduced by design features that maintain a high hydraulic efficiency (e.g., do not use a recessed impellor) and a low speed (e.g., large impellor diameter). Multiple stages can be used to reduce the head per stage.
Another option to using a modified centrifugal pump is to use a positive displacement pump. As shown in Fig. 4, there are a number of positive displacement pump types that generate less shearing than a centrifugal pump. Several pump manufacturers have improved the reliability of these alternative pump types in the past 20 years making them a viable alternative.
In some water treatment process systems, a booster pump is required for recycling fluids into an upstream location. An example would be the case where the water discharge from a bulk oil treater is routed to the freewater knockout. This is not necessarily a recommended routing. However, where such routing, or similar routing, does occur a pump is required to move the fluid from the downstream lower-pressure location into the upstream higher-pressure location. Pumps that are imbedded in the process system need to be controlled in such a way that they do not cause level control problems in either the vessel that provides the feed fluid or the part of the system that they are pumping into. Two design scenarios are shown in Fig. 5.
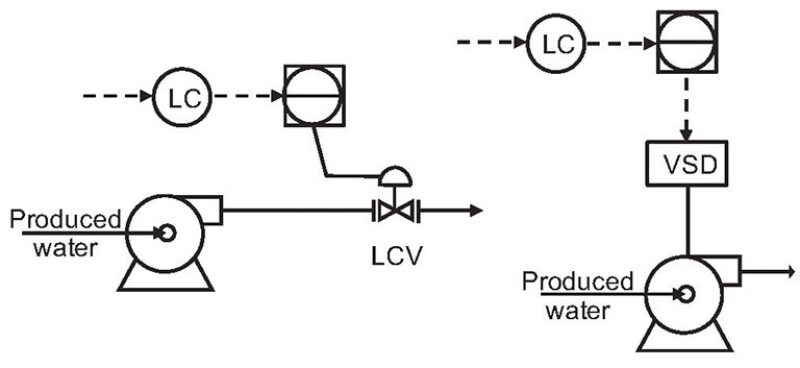
On the Auger platform in the US Gulf of Mexico, the scheme on the left of the figure was replaced with the scheme on the right and water quality was improved.
Valves. There are fewer options for reducing the shear in valves than there are for pumps. Pressure control is paramount in processes such as well control, sand control, hydrate control, oil conditioning, and gas gathering and compression. However, there are some options. First, the application of a properly chosen chemical can reduce the effect of valve shearing. The mechanisms are not well understood but are believed to be related to promoting droplet coalescence. In every instance of shearing, there is a gradual reduction of shear and the fluid emerges from the valve or pump. As shear decreases, the fluid enters a zone where the turbulent energy dissipation rate is favorable for droplet-droplet collision and coalescence. Chemicals that migrate to the oil/water interface force other surface active molecules away from the interface and can reduce the effect of shear by promoting coalescence. These chemicals can also be used on their own in moderate shear zones. Location of shearing can also be a factor. If the location of a valve can be moved farther upstream from the separation equipment, then there will be additional time for drop-drop coalescence to occur before separation.
Finally, a promising area is the development of lower-shear valves. There are several candidates being developed and tested. They almost all rely on extending the time over which the fluid experiences the pressure drop. According to Eq. 4, this reduces the turbulent energy dissipation rate. Since the pressure drop is fixed by the process conditions, the only variable left is the time.
A promising valve is the Typhoon valve (Husveg et al 2009). It was designed using hydrocyclone principles where a swirl motion is induced in the fluid as it passes through the pressure-reducing zone of the valve. The fluid mechanics of the swirl motion cause the pressure drop to be much more gently applied and hence, less intensely. Field testing has been carried out as shown in Fig. 6.
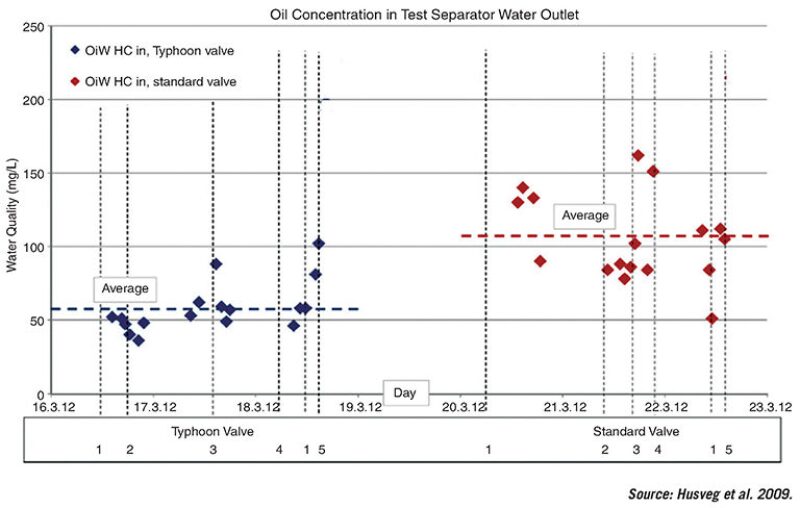
The process configuration for these tests is as follows. The test valves (typhoon vs. standard) were installed just upstream of the test separator. The valve was adjusted to various settings (1–5 in Fig. 5). The water quality (y-axis: oil-in-water concentration) was measured for the oily water discharge from the test separator. Droplet size was not measured. Although measurement of droplet size would have been scientifically interesting, the measurement of oil-in-water concentration after settling in the test separator, under controlled conditions, is more reliable offshore. The improvement seen in the oil-in-water concentration using the Typhoon valve indicates that the valve provides less shearing and hence larger oil droplets which rise more quickly in the separator.
Conclusions
There are many sources of shear in upstream oil and gas development. Mild shear is actually a benefit in that it promotes oil droplet coalescence which improves oil/water separation. On the other hand, high-intensity shear gives rise to small droplets which can result in poor oil/water separation even with equipment and chemical treatment programs that are working well. Being able to recognize when shearing can and should be reduced, and what are the options for doing so, are useful capabilities. Engineering formulas for calculating the magnitude of shear and relating it to oil droplet size have been provided. Options regarding types of pumps, pumping systems, and valves have been discussed. It must be noted that this is only a brief high-level discussion of an interesting and important subject.
I would like to thank STTS members Mark Bothamley, Robert Chin, Ed Grave, Victor van Asperen, Cris Heijckers, Richard Arntzen, and Graeme White for their valuable review and contributions to this article.
For Further Reading
Arnold, K.E. 1991. Water Treating Using a Series Coalescing Flume. US Patent 4,983,287. See also, US Patent 4,935,154 (1990); US Patent 4,790,947 (1988); and US Patent 4,720,341 (1988).
Arnold, K. and Stewart, M. 2008. Surface Production Operations: Design of Oil Handling Systems and Facilities, third edition, Amsterdam, The Netherlands: Gulf Professional Publishing.
Davies, J.T. 1985. Drop Sizes of Emulsions Related to Turbulent Energy Dissipation Rates. Chem. Eng. Sci., 40(5): 839–842.
Ditria, J.C. and Hoyack, M.E. 1994. The Separation of Solids and Liquids With Hydrocyclone-Based Technology for Water Treatment and Crude Processing. Paper presented at the SPE Asia Pacific Oil & Gas Conference, Melbourne, Australia, 7–10 November. SPE 28815.
Flannigan, D.A., Stolhand, J.E., and Scribner, M.E. et al. 1988. Droplet Size Analysis: A New Tool for Improving Oilfield Separations. Paper presented at the 63rd Annual Technical Conference and Exhibition, Houston, Texas, USA, 2–5 October. SPE 18204.
Hinze, J.O. 1955. Fundamentals of the Hydrodynamic Mechanism of Splitting in Dispersion Processes, AIChE J., 1(3): 289–295.
Husveg, T., Bilstad, T., Guinee, P.G.A. et al. 2009. A Cyclone-Based Low Shear Valve for Enhanced Oil-Water Separation. Paper presented at the Offshore Technology Conference, Houston, Texas, USA, 4–7 May. OTC 20029. See also: www.typhonix.com.
Liao, Y. and Lucas, D. 2009. A Literature Review of Theoretical Models for Drop and Bubble Breakup in Turbulent Dispersions. Chem. Eng. Sci., 64(15): 3389–3406.
Liao, Y. and Lucas, D. 2010. A Literature Review on Mechanisms and Models for the Coalescence Process of Fluid Particles. Chem. Eng. Sci., 65(10): 2851–2864.
van der Zande, M. 2000. Droplet Break-up in Turbulent Oil-in-Water Flow Through a Restriction. Thesis submitted to Delft University of Technology, Delft, The Netherlands.
van der Zande, M.J., Muntinga, J.H., and van den Broek, W.M.G.T. 1998. Emulsification of Production Fluids in the Choke Valve. Paper presented at the Annual Technical Conference and Exhibition, New Orleans, Louisiana, USA, 27–30 September. SPE 49173.

recently joined Cetco as director of consulting services. He has nearly 30 years' experience in water treatment having worked for Shell for more than 20 years, and Westvaco Paper Co. prior to Shell. Walsh is the president and managing director of the Produced Water Society. He served as the SPE Technical Director of Projects, Facilities, and Construction at the time the Separations Technology Technical Section was formed and saw firsthand the behind-the-scenes work to set up the technical section. This article is his way of supporting the collaborative efforts of this outstanding technical section. He may be reached at john.walsh@cetco.com.

